International
Economics: Homework 1
1)
Chapter 2:
Use
a graph to show how general equilibrium is reached when a country is subject to
increasing opportunity costs.
Show
the PPF with increasing opportunity costs.
Find and label the country's equilibrium
production and consumption points and the relative price of S at equilibrium.
Show an alternative equilibrium that is not
optimal – does not maximize consumer benefits.
Answers:
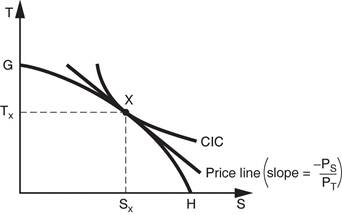
** For the third part, draw a CIC below the
one shown here that intersects the PPF
2) Chapter 2:
a. Using the PPF describe how the national supply curve for Good S is
found. No graphs are required here but you can include them if you like.
b. Using the PPF and CICs describe how the national demand curve Good
S is found. No graphs are required here but you can include them if you like.
c. How is the domestic price of Good S determined?
Answers:
a. The national supply
curve for Good S is found along the nation’s PPF using different price ratios
for Ps/Pt. For each price ratio locate a production point along the PPF that
shows the price of S and production of S correlated to that price.
b. The national demand
curve for Good S is found along the nation’s PPF using different price ratios
for Ps/Pt. For each price ratio locate a CIC tangent to the PPF that shows the
price of S and consumption of S correlated to that price.
c. The domestic price of
Good S determined by the equilibrium of supply and demand.
3) Chapter 2:
a. Assuming autarky, in a two good economy what is the formula to
calculate nominal GDP?
Answer:
a.
GDP = Ps
x S + PT x T