Greg Kopp's TSI Page
Updated 5 Aug. 2025
Click on figures to enlarge or save
News
SORCE:
After more than 17 years on orbit and with its TIM instrument having produced one of the longest and most stable TSI data records of any space-borne instrument, the SORCE was decommissioned on 25 February 2020.
 V.20 data have just been released. They are plotted below, and the daily data are available
here.
They are intended to contain the final instrument calibrations and be the last data version from the SORCE/TIM. These data have a slightly higher absolute value and lower uncertainties than the prior version. The V.20 data use the "hybrid" data-processing approach of the TSIS-1/TIM.
V.20 data have just been released. They are plotted below, and the daily data are available
here.
They are intended to contain the final instrument calibrations and be the last data version from the SORCE/TIM. These data have a slightly higher absolute value and lower uncertainties than the prior version. The V.20 data use the "hybrid" data-processing approach of the TSIS-1/TIM.
Key SORCE/TIM achievements are detailed below and include: establishing a
new lower TSI value;
making the
first measurement of a solar flare in TSI;
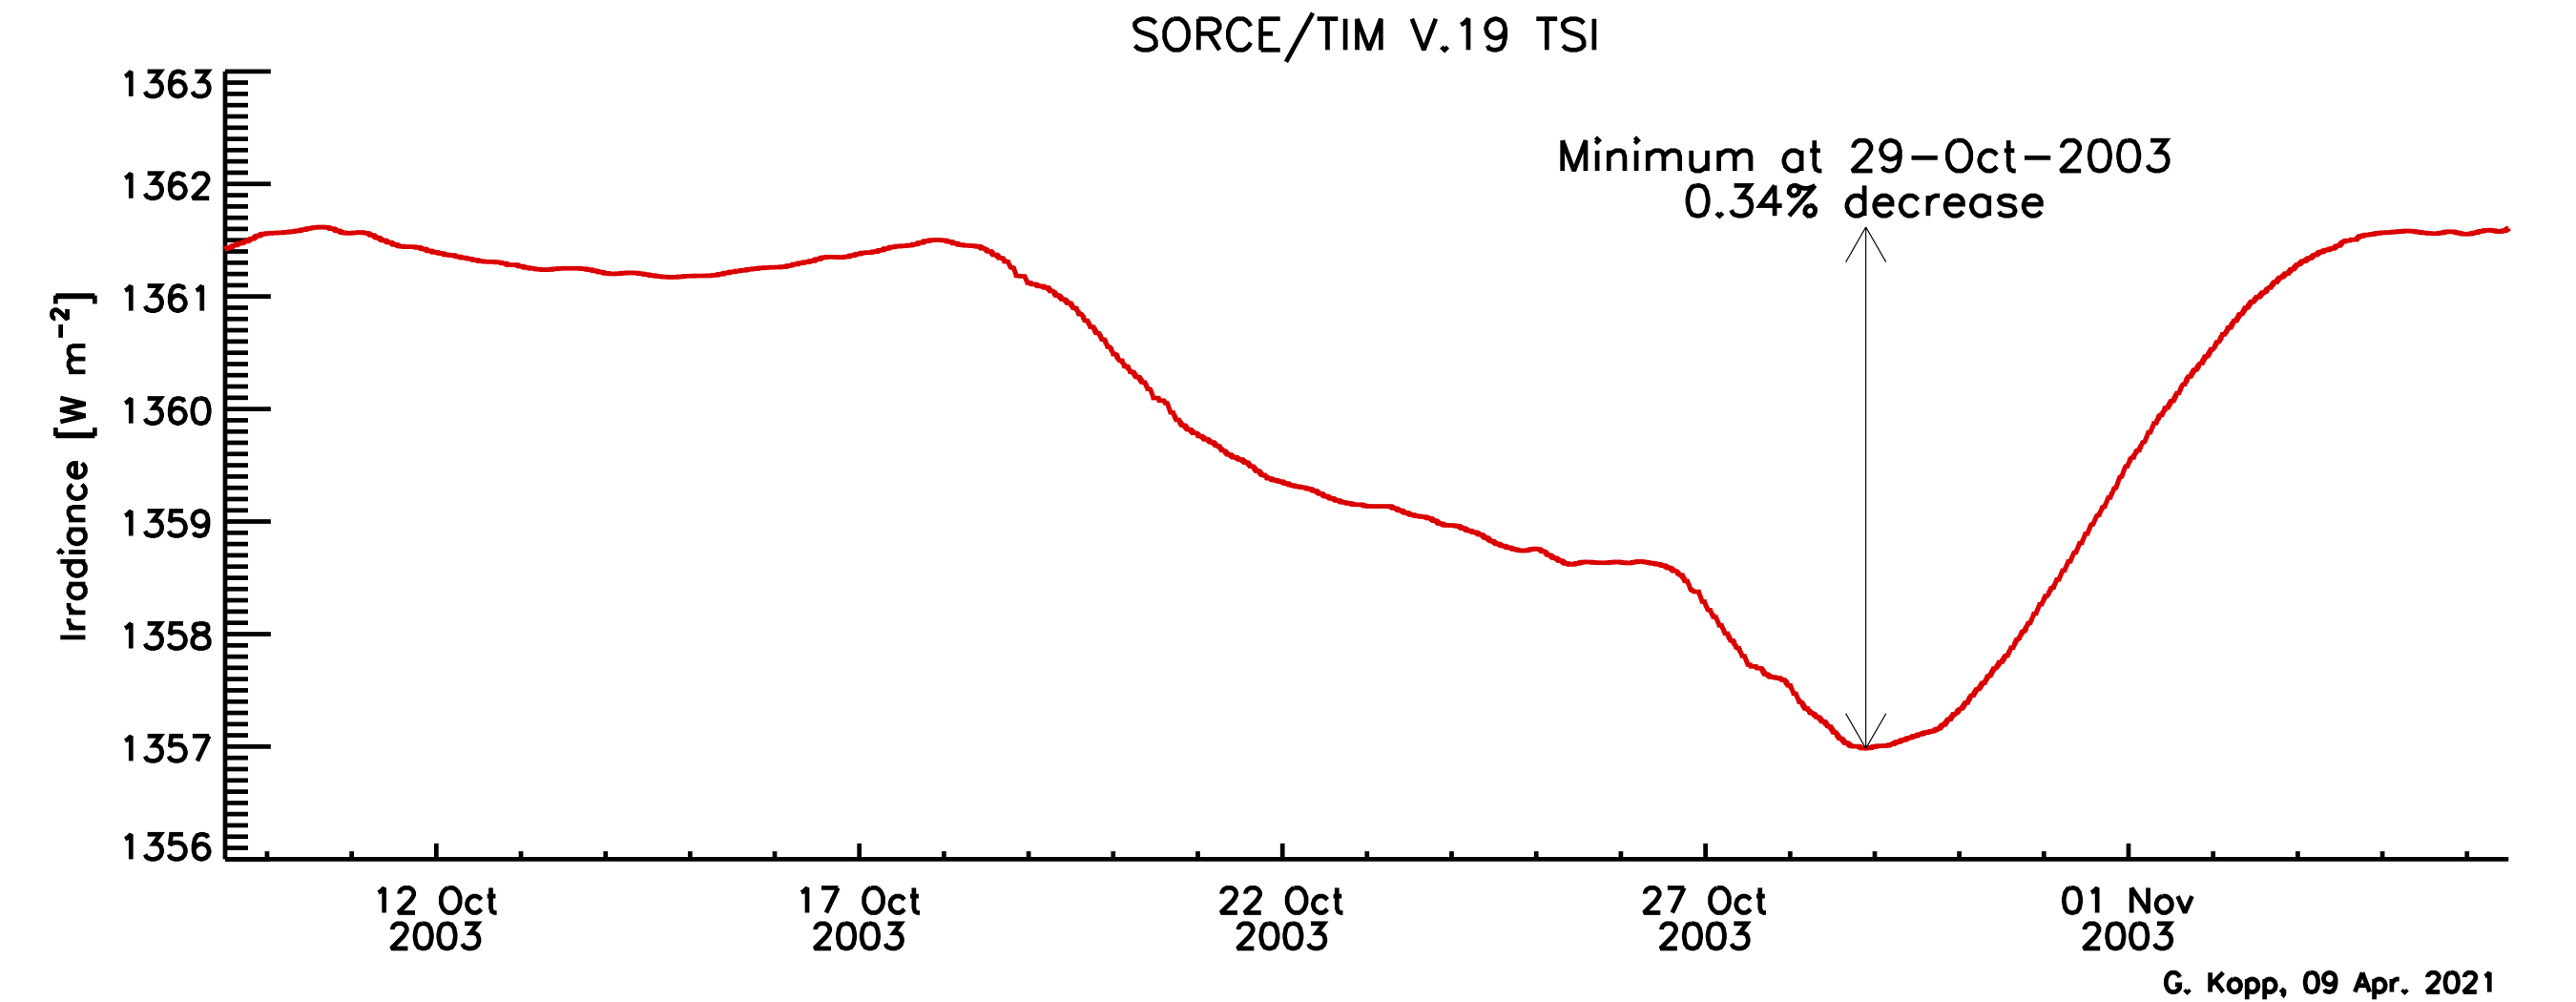
quantifying the
largest short-term decrease ever measured in TSI;
and observing several
planetary transits.
TCTE:
Intended to bridge a potential measurement gap between the SORCE/TIM and the TSIS-1/TIM, the
TCTE/TIM,
a ground-calibration instrument built alongside the original SORCE/TIM, was launched in 2013. That potential gap was avoided by direct temporal overlap between the SORCE and TSIS-1, so the TCTE was powered off on 30 June 2019. Six weeks prior, however, an anomaly affected the instrument's controlling computer, meaning no data were acquired after 15 May 2019. This was not apparent at the time since the Air Force had not been able to deliver instrument data due to an issue that started several months prior. Those data were only delivered after the instrument power-off on 30 June, at which time it was realized that
the mission effectively ended on 15 May 2019.
The latest data version (V.4) from the TCTE/TIM have been produced. One more data version is expected for this instrument.
One of the primary benefits of the TCTE/TIM is that it helped confirm the
new lower TSI value
established by the SORCE/TIM.
TSIS-1:
The
TSIS-1/TIM
is similar to the TIM on the SORCE and TCTE but with improved electronics from those instruments. As part of the continuing TSIS series, this TIM is intended to provide the TSI climate data record into the foreseeable future.
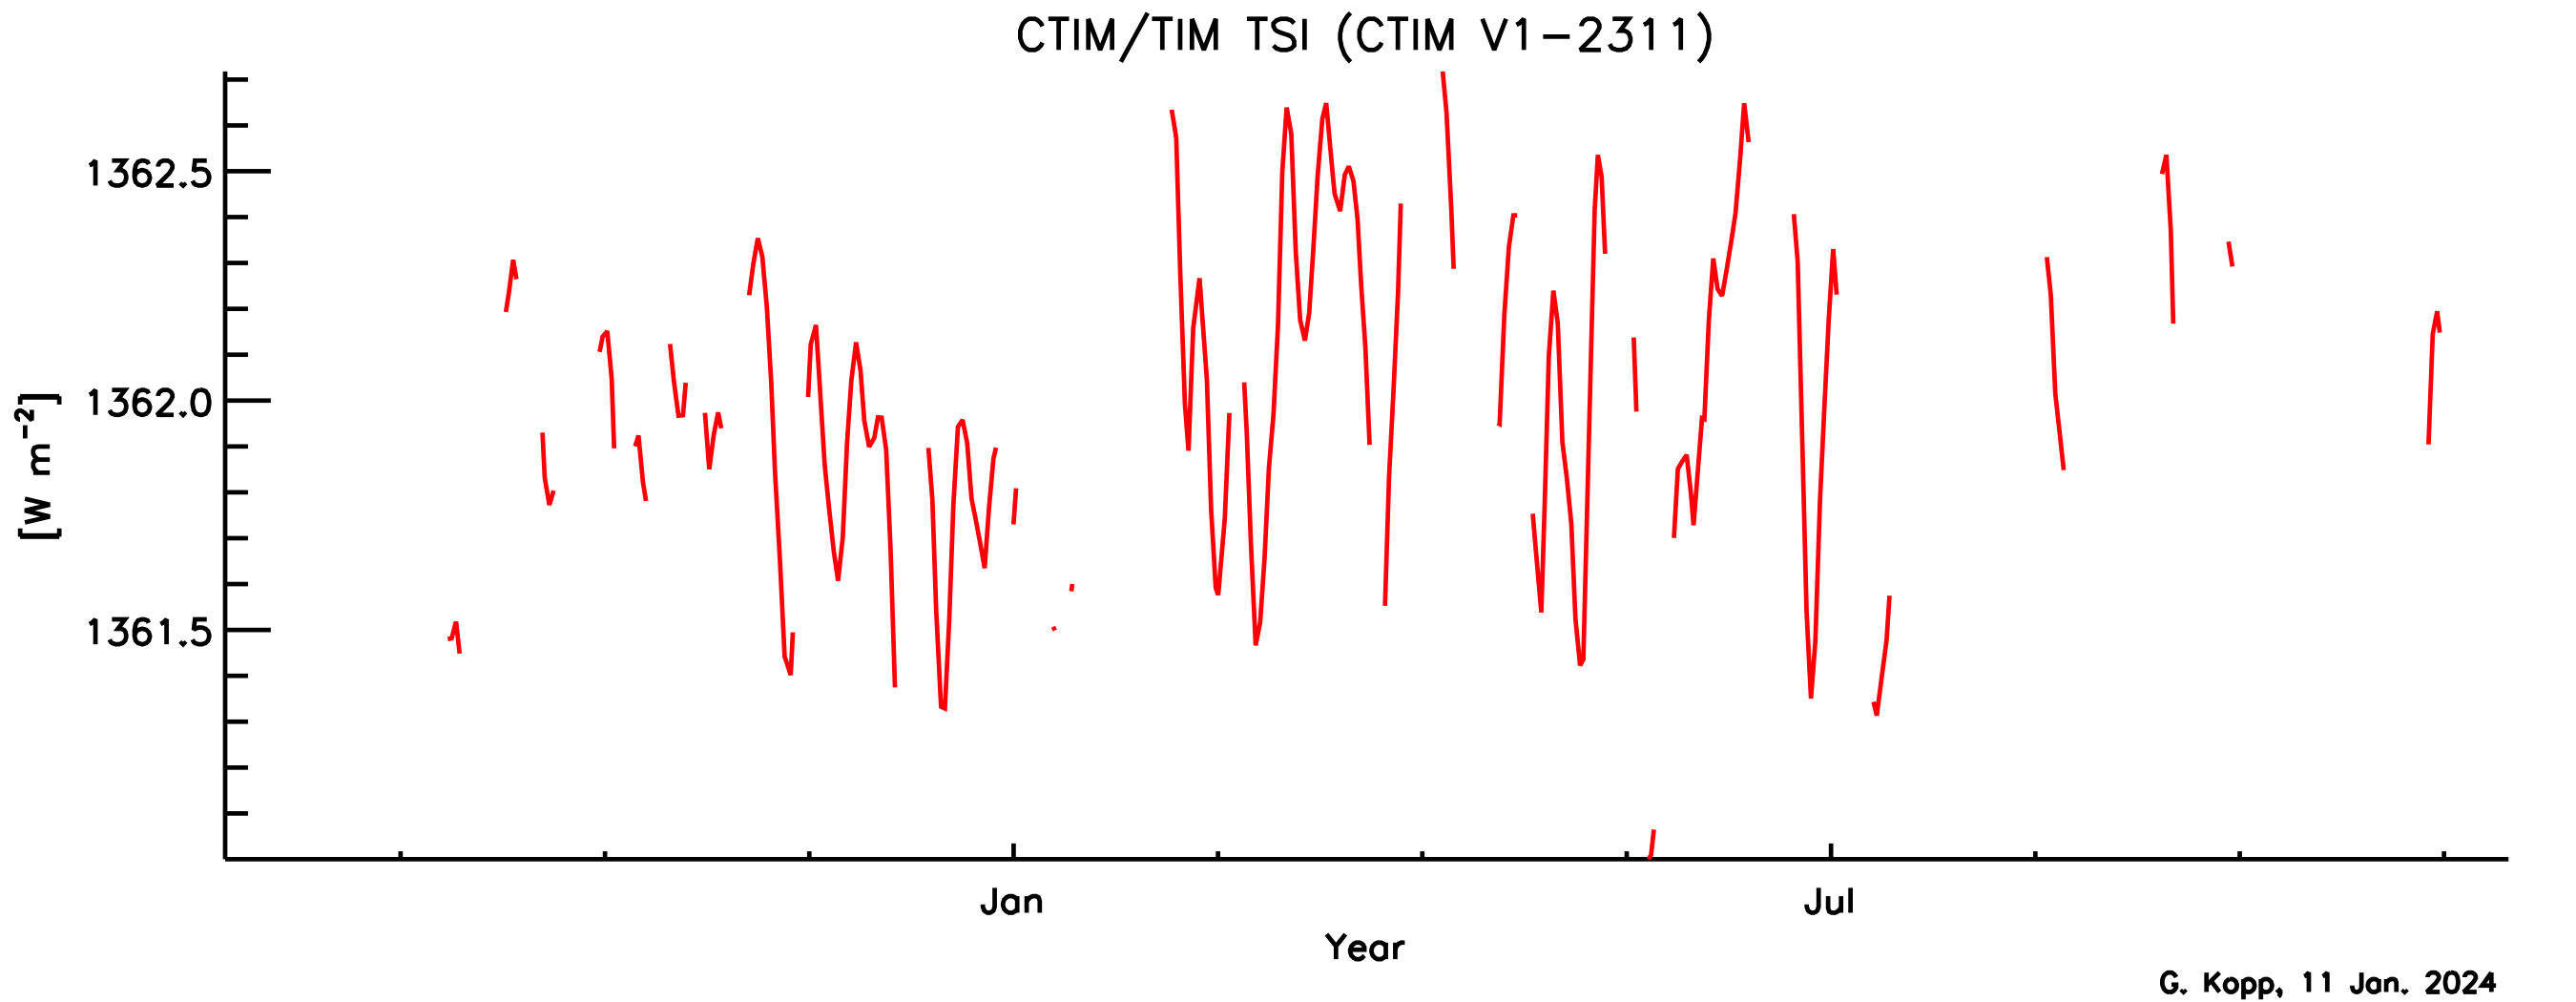
CTIM:
The
CTIM
is an InVEST (technology demonstration mission) flying eight new bolometers of carbon nanotubes on silicon.
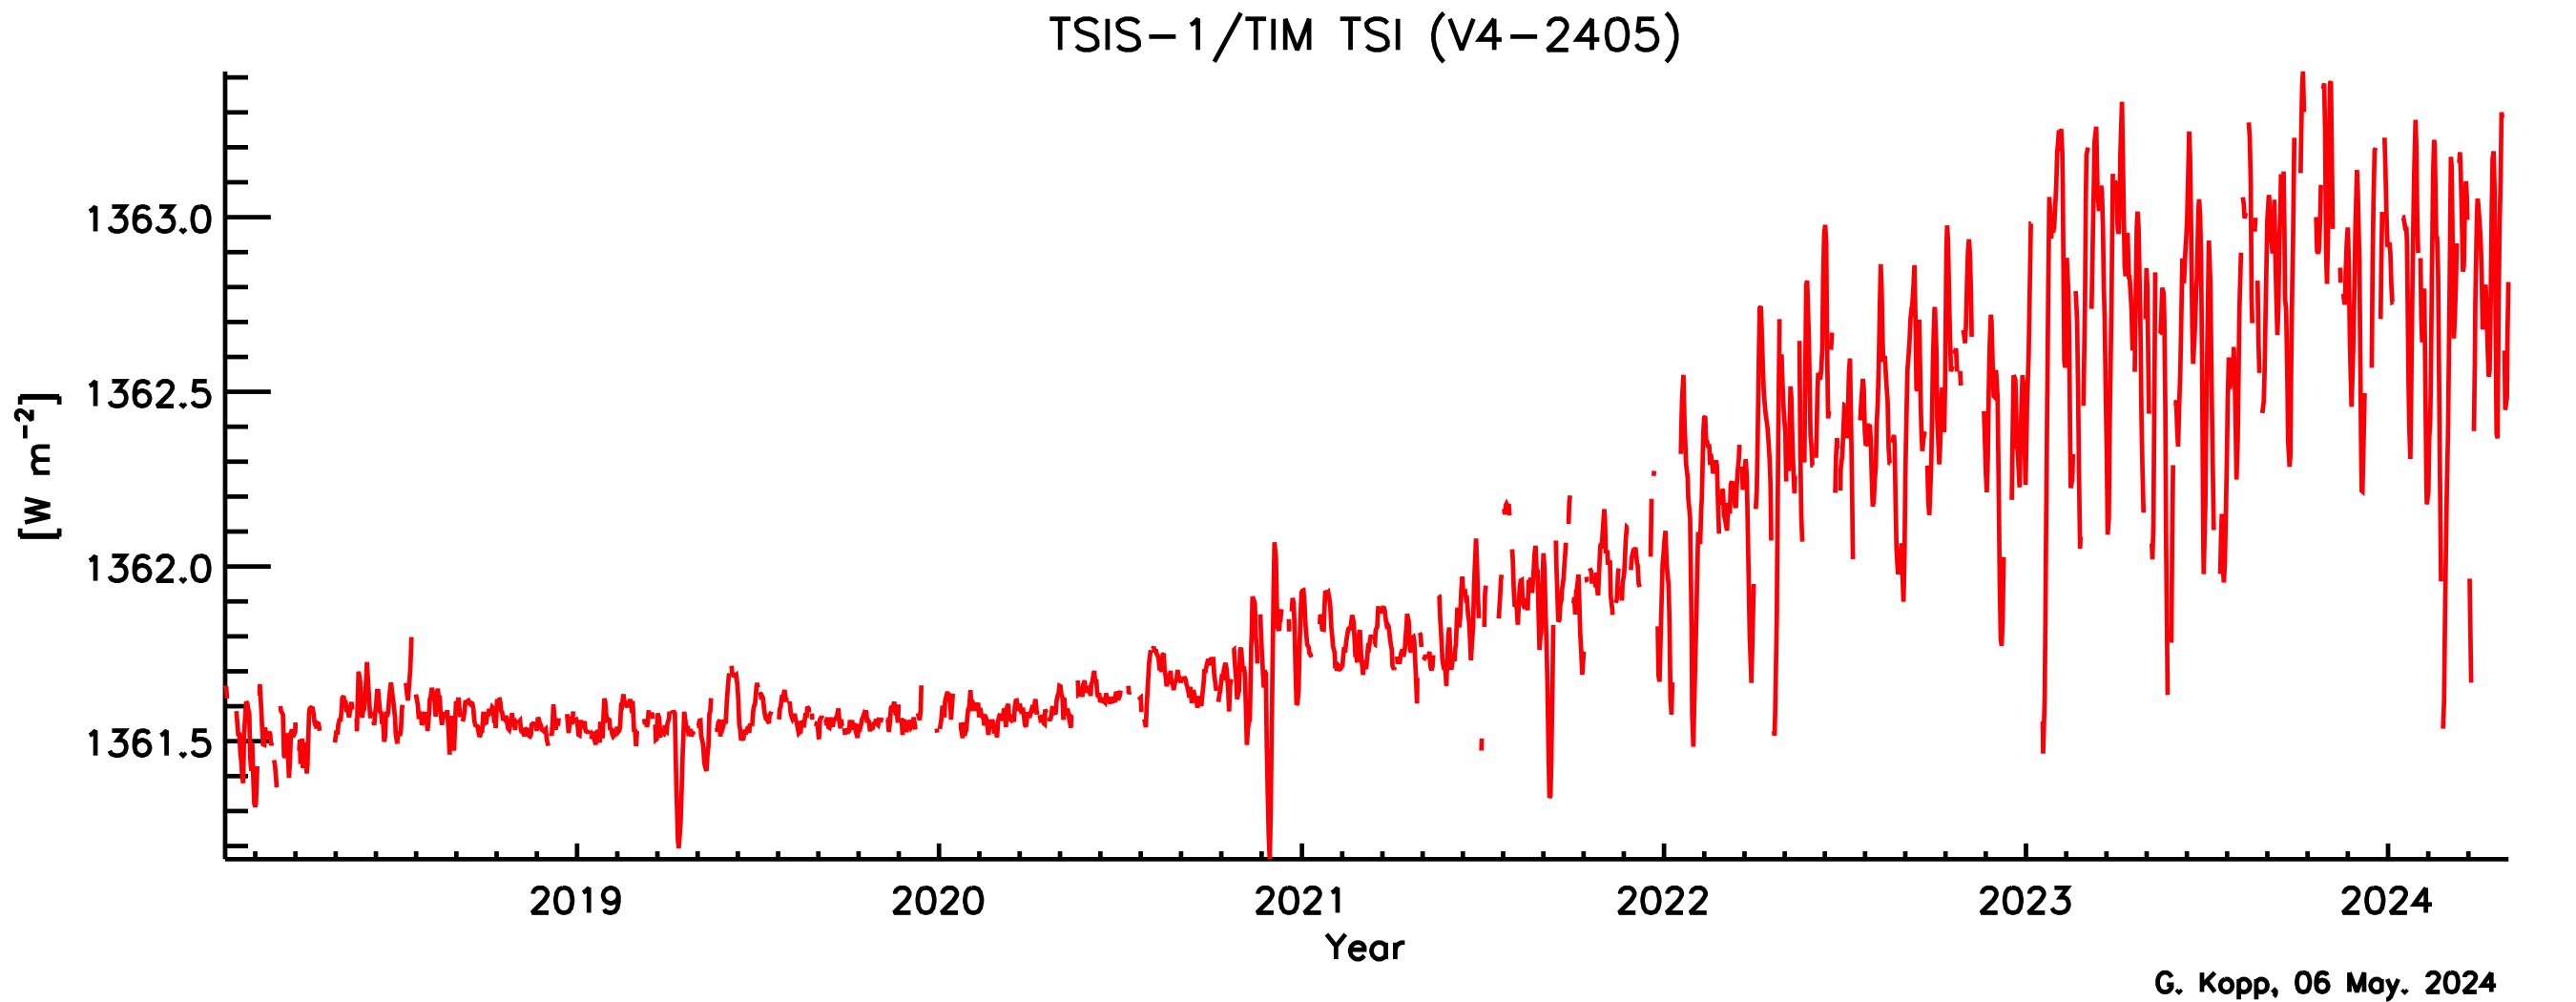
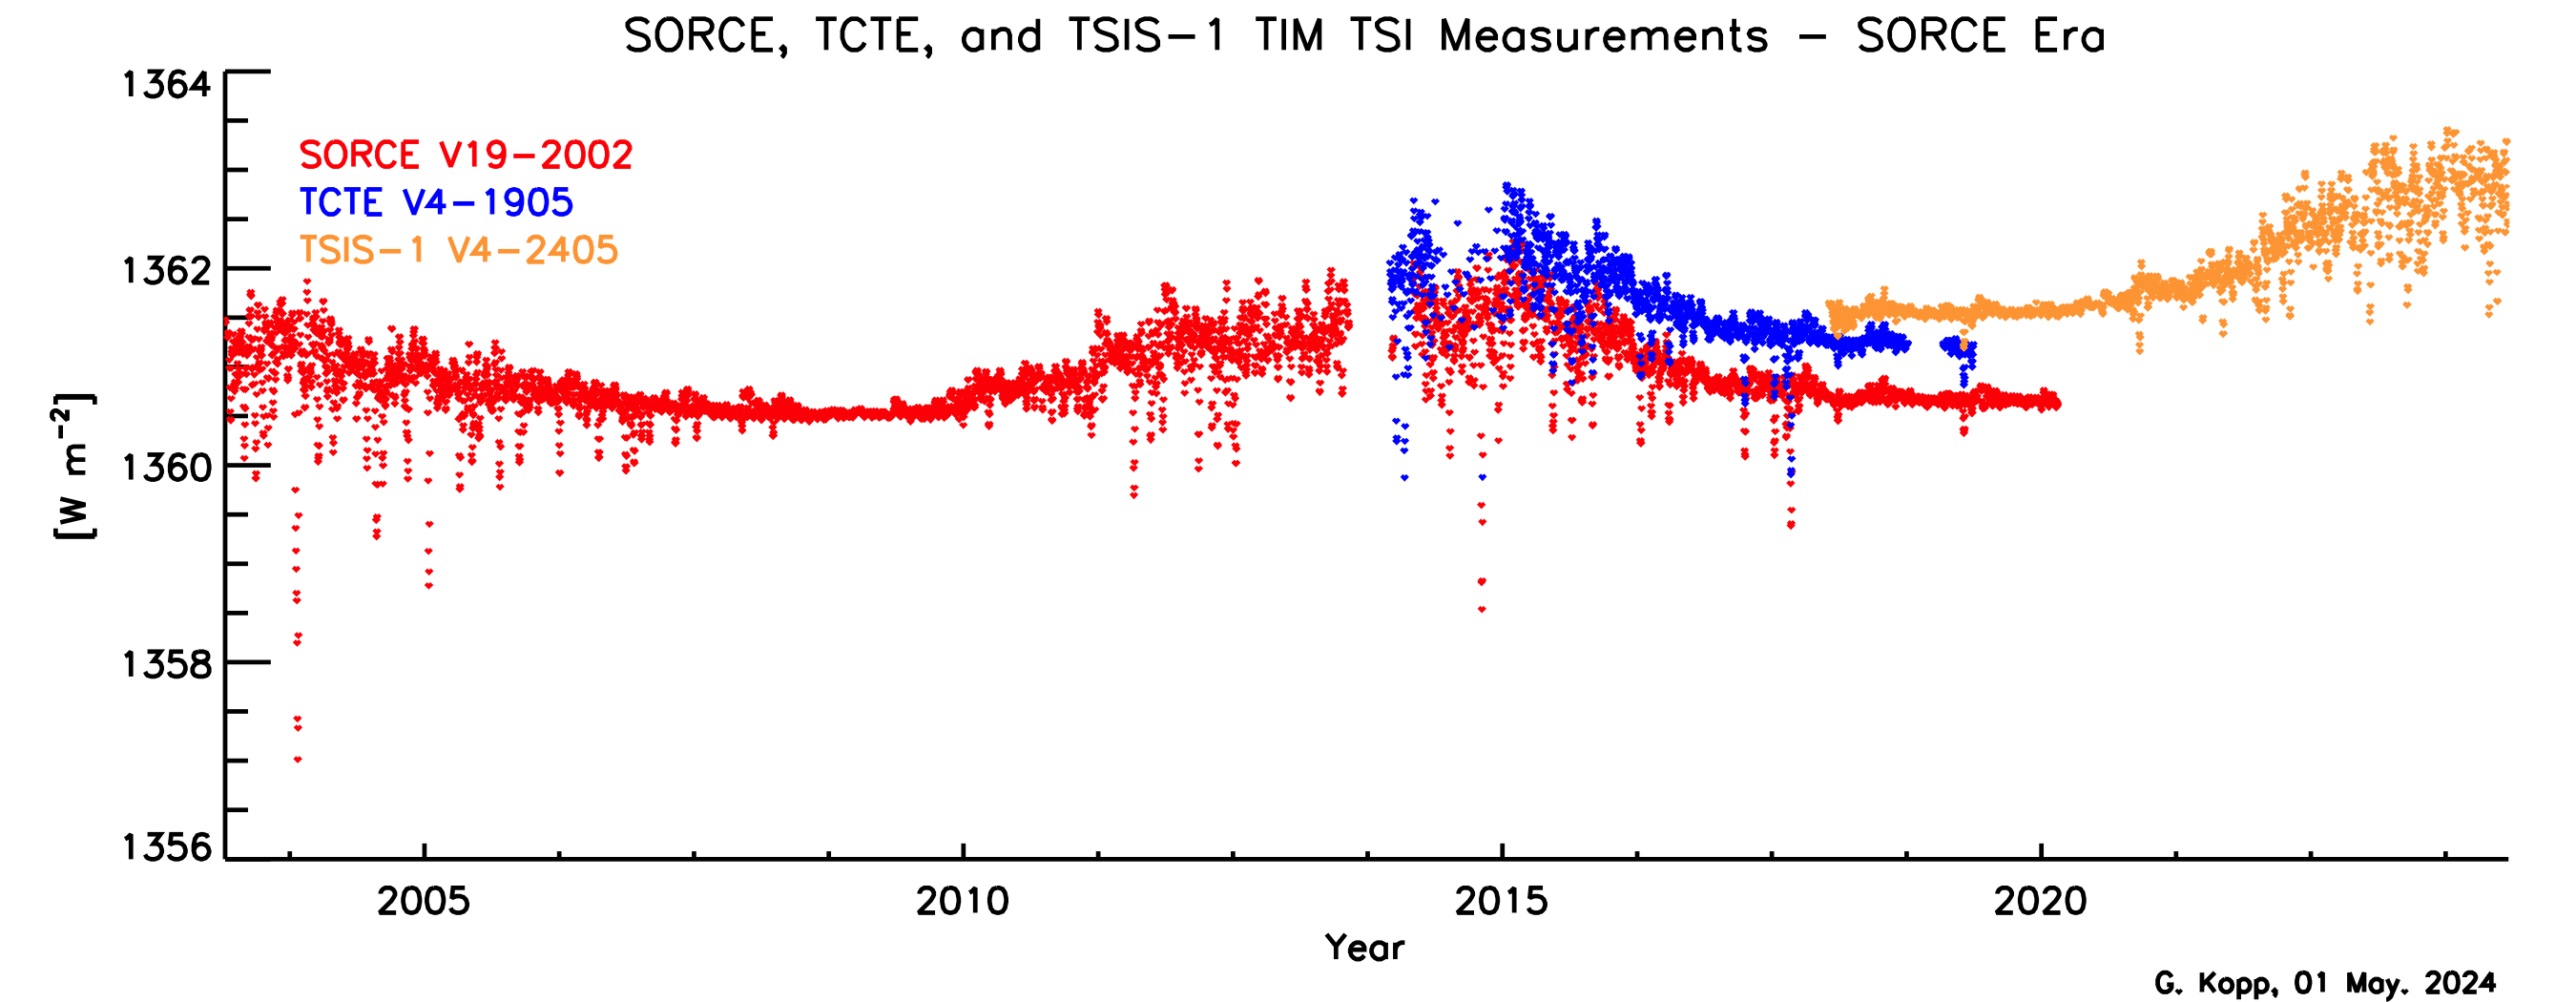
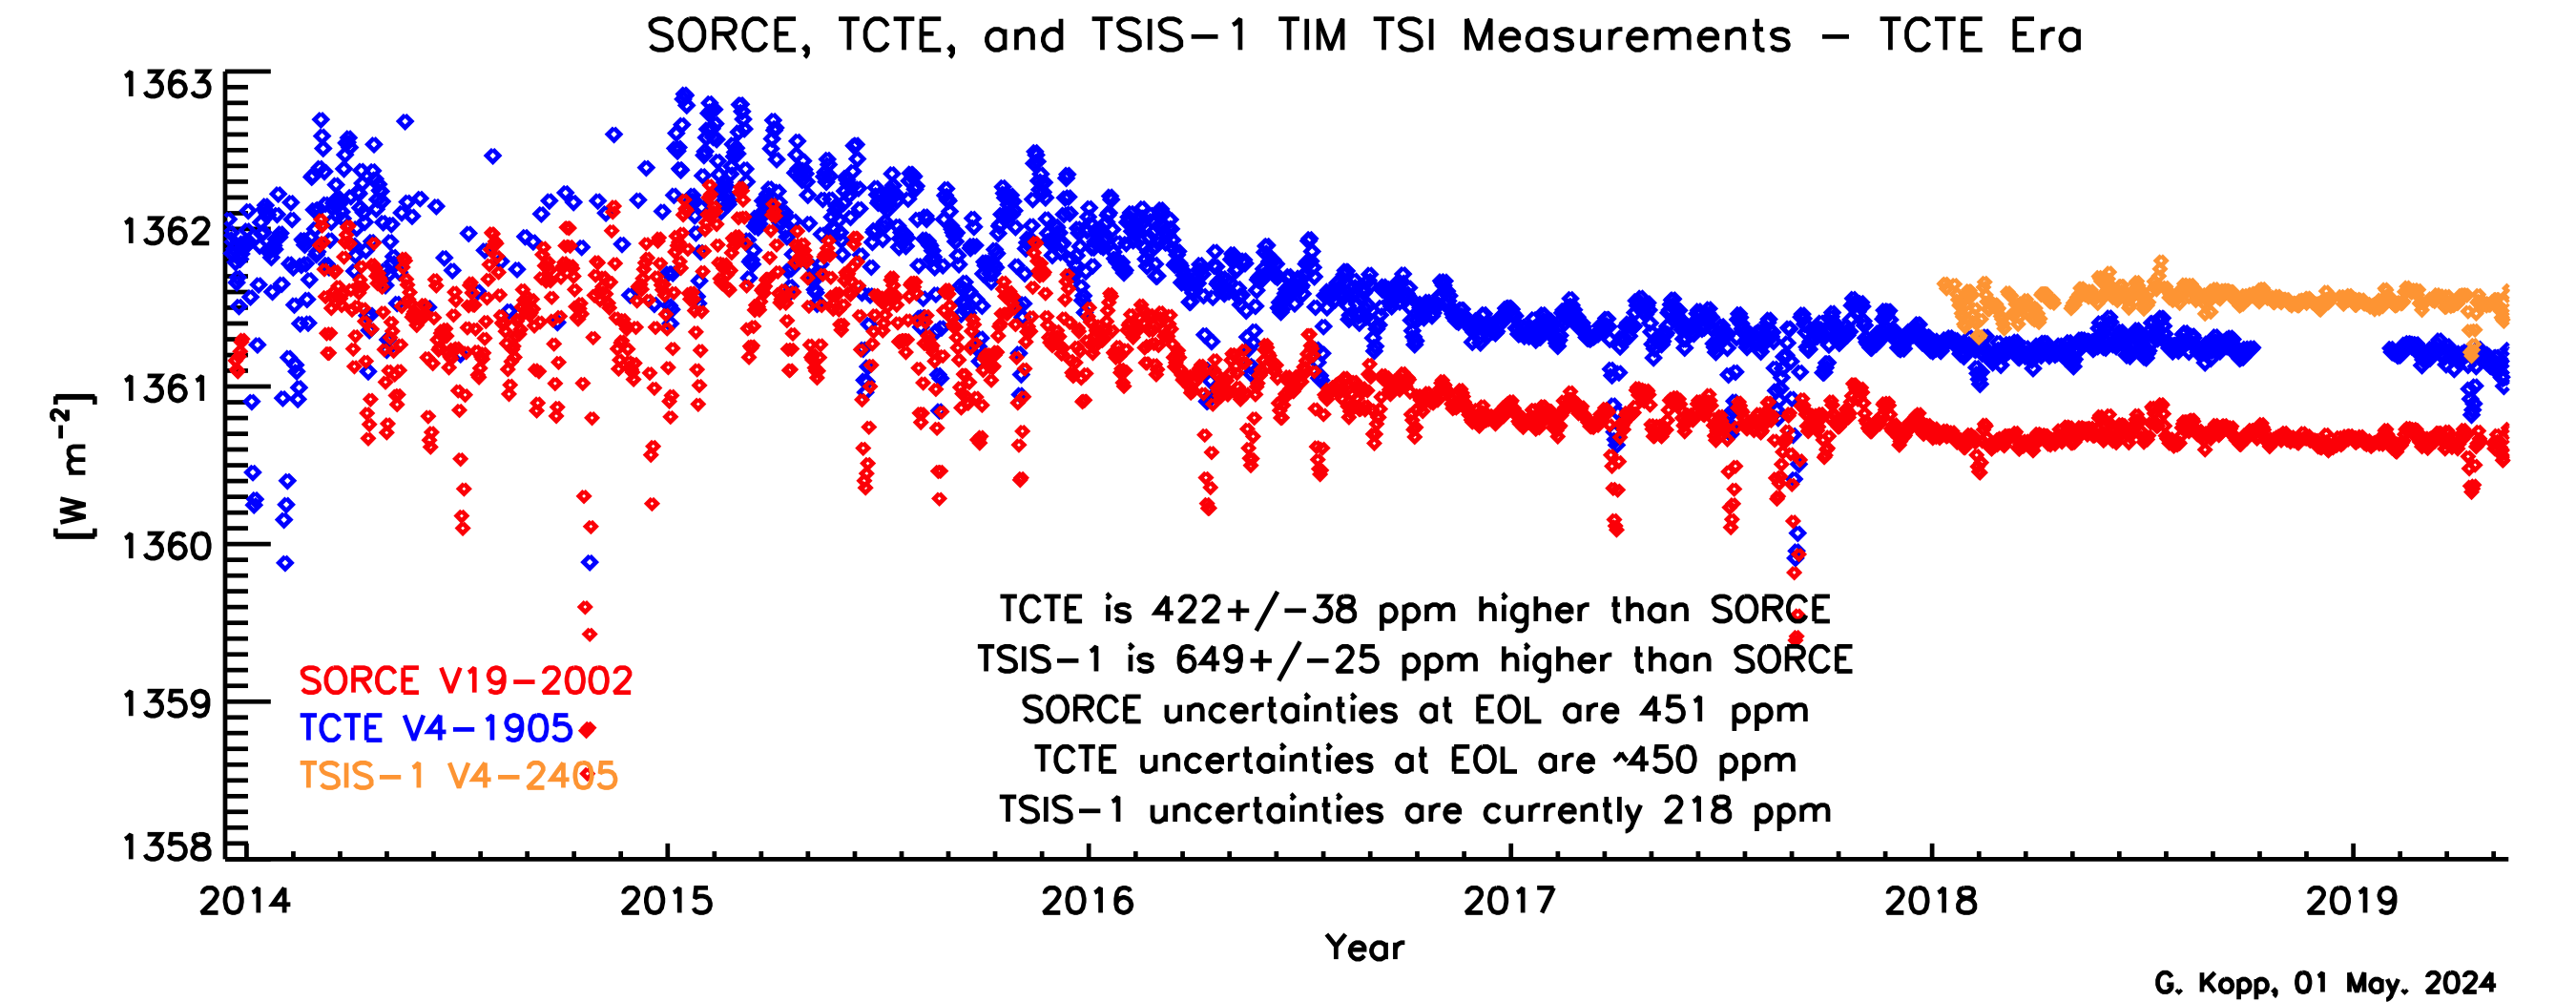
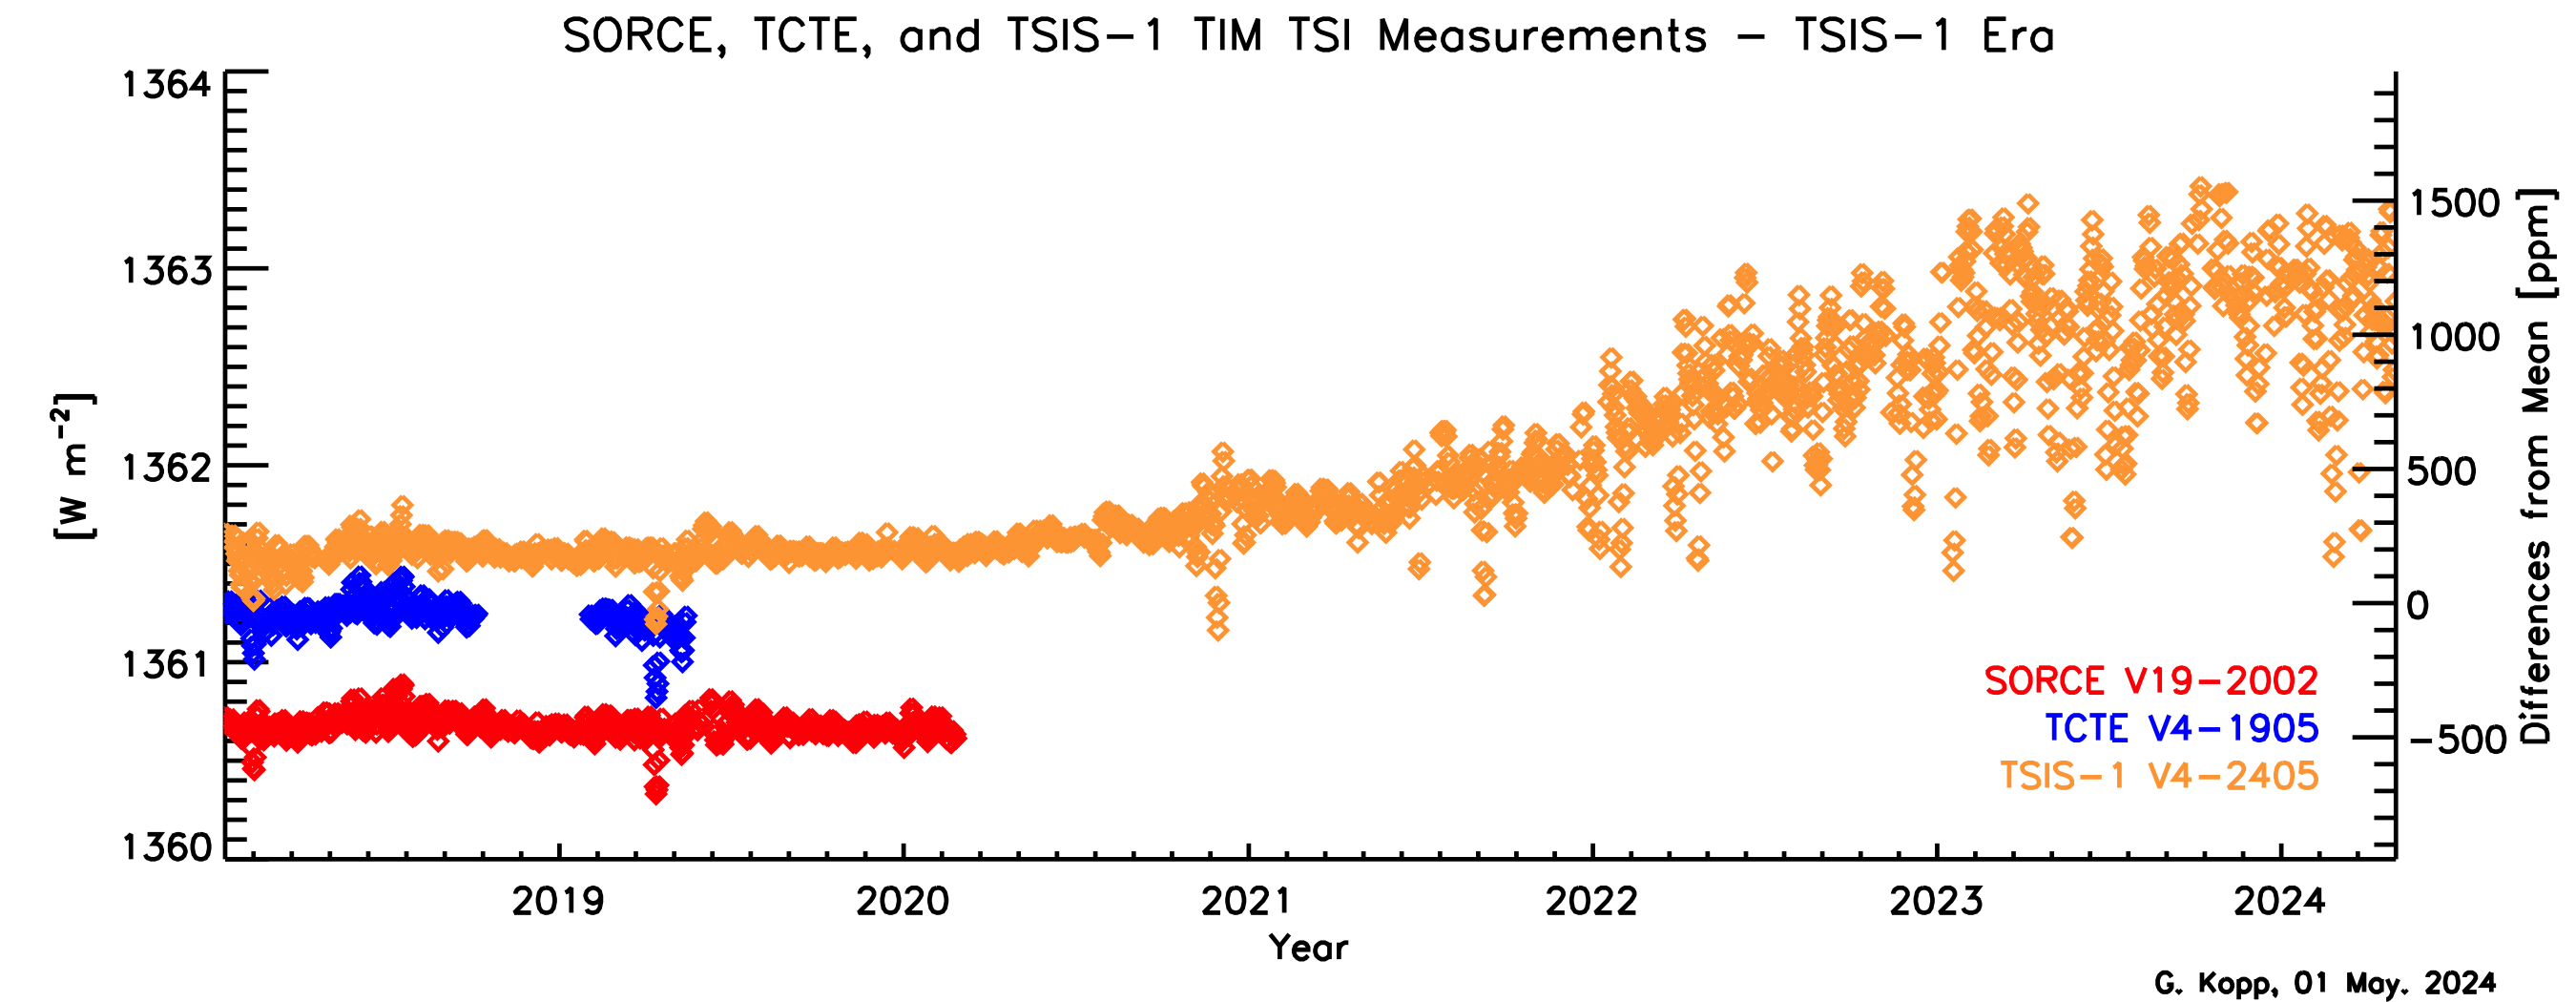
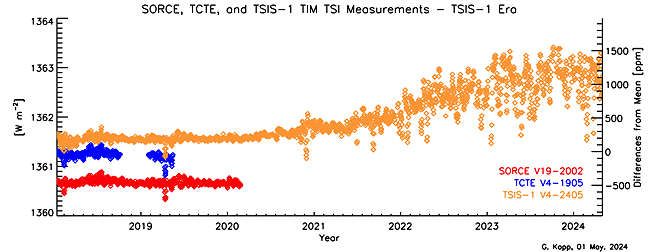
Current SORCE, TCTE, TSIS-1 TIM and CTIM Data Plots
Daily and 6-hourly averaged
SORCE/TIM data
are available from 25 Feb. 2003 to 25 Feb. 2020,
TCTE/TIM data from 13 Dec. 2013 to 15 May 2019,
CTIM data since 5 Aug. 2022, and
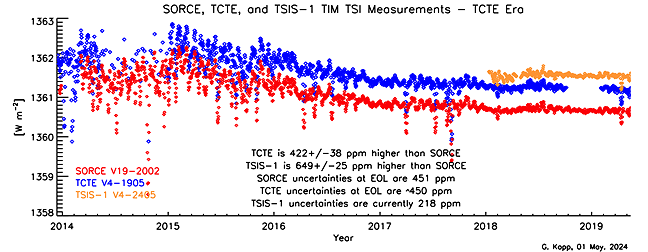
TSIS-1/TIM data since 11 Jan. 2018. The latter are updated and released five days in arrears.
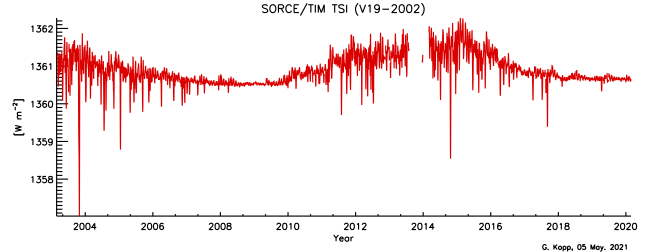
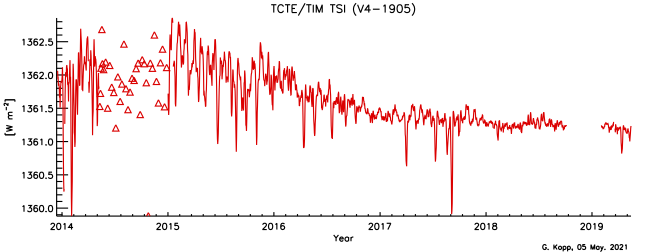

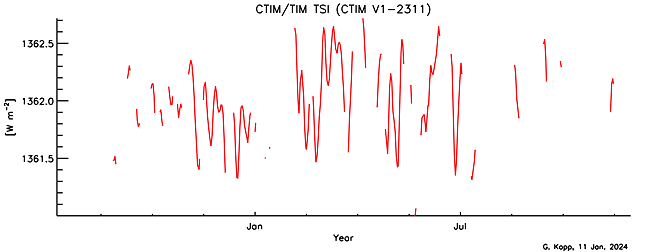
The plots below show the excellent agreement on an absolute scale of the TSIS-1/TIM instrument with the prior two TIMs even though they were calibrated independently at the component level over a 15-year time span. Differences are within the stated uncertainties of the three instruments.

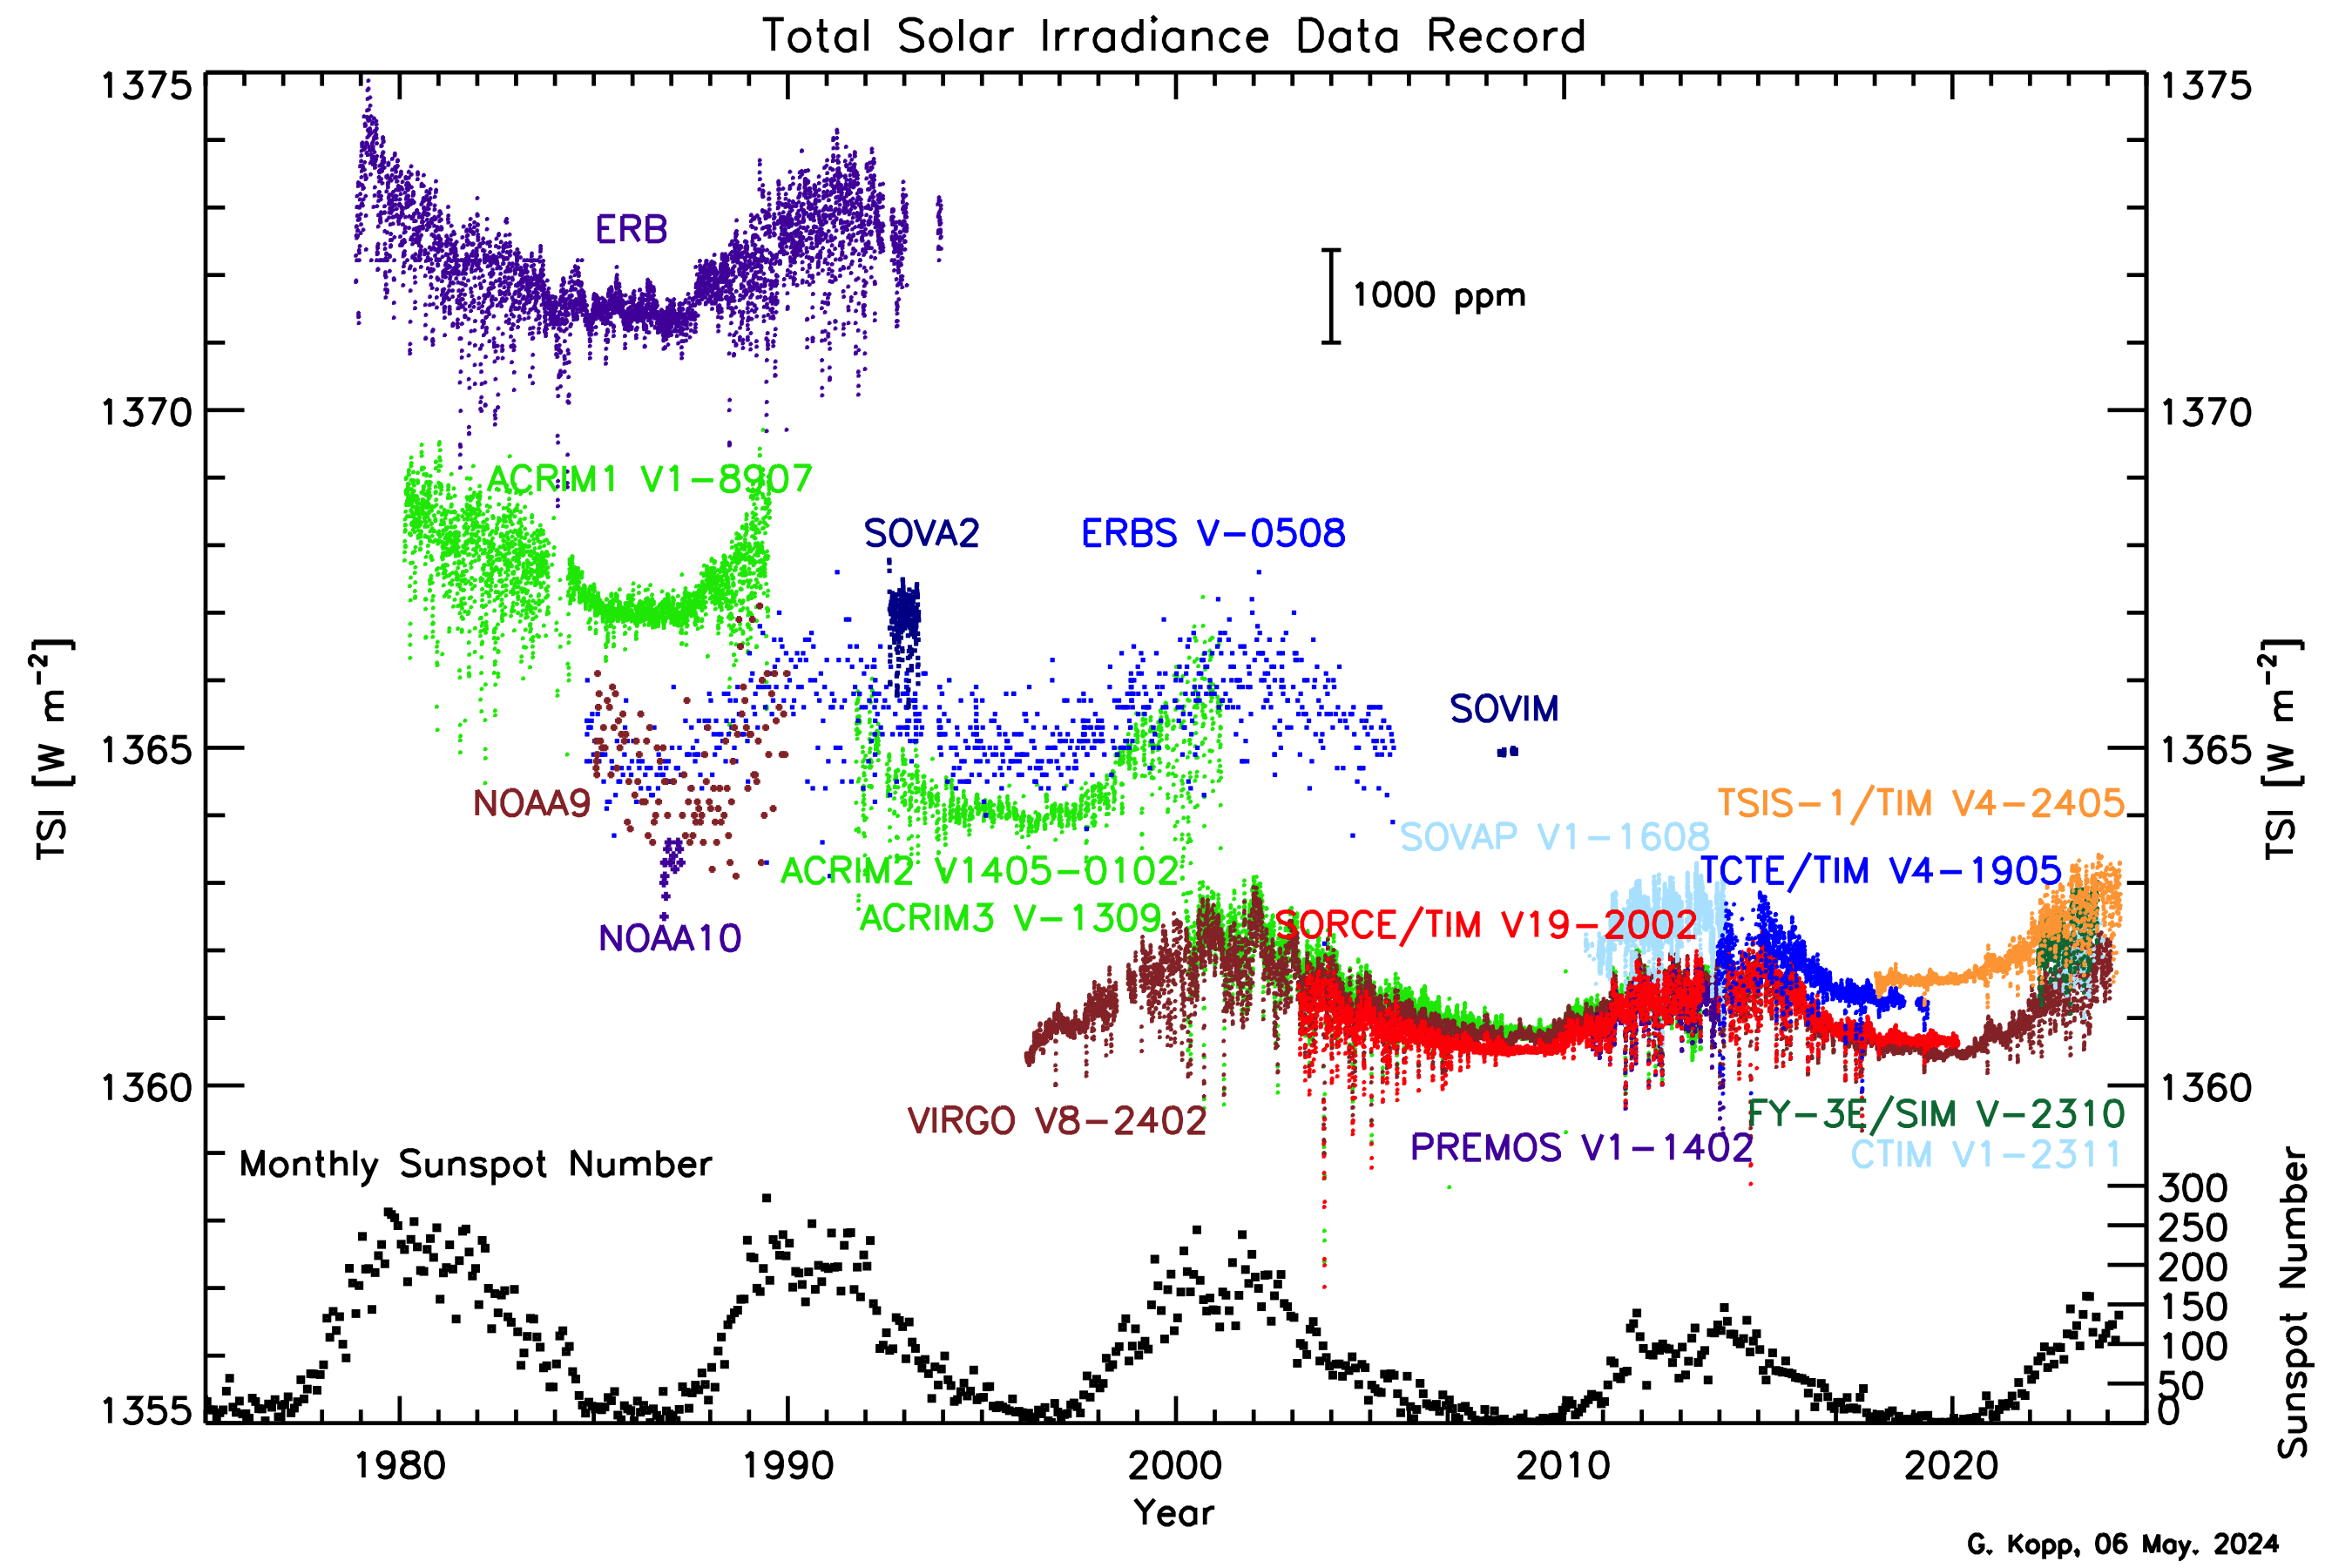
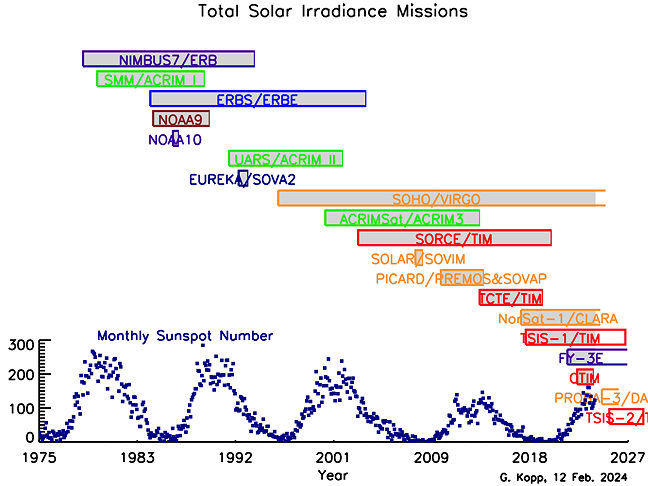
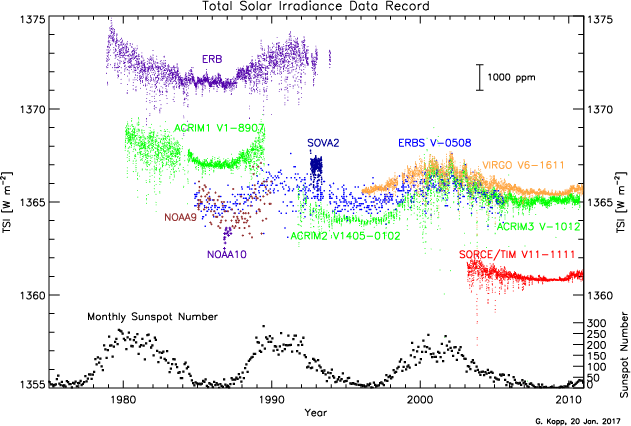
TSI Climate Data Record
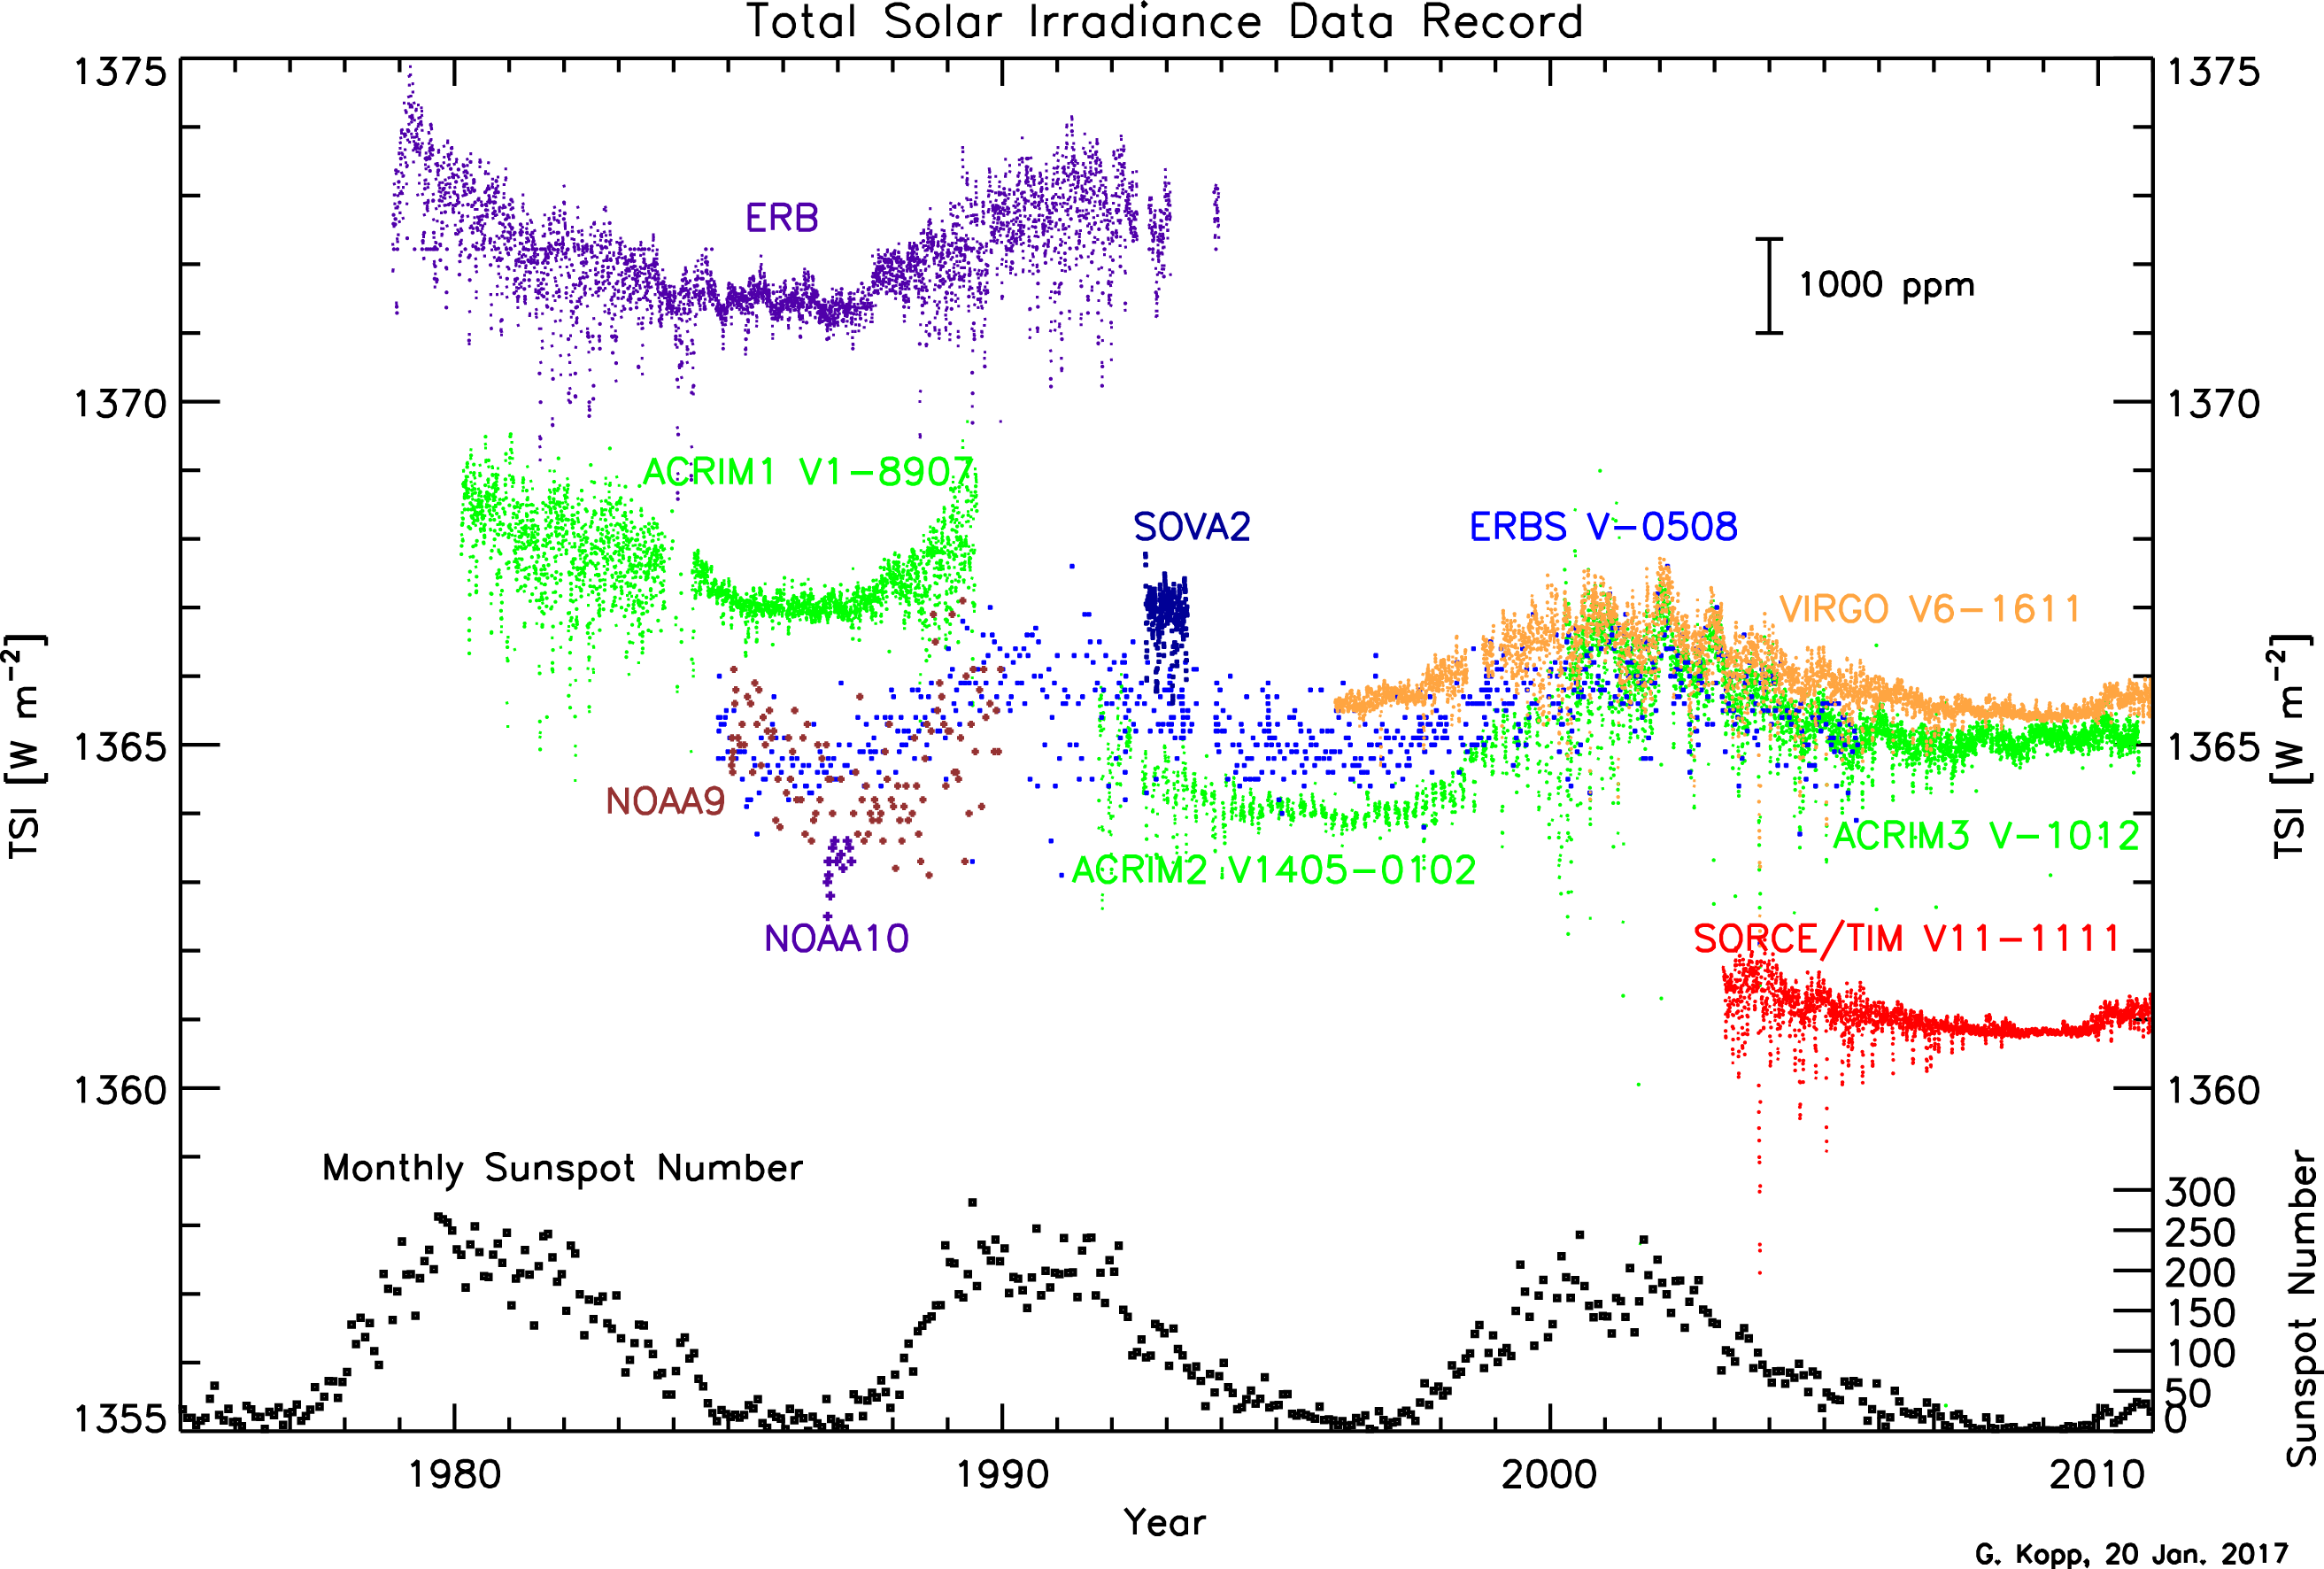
The TSI Climate Data Record now spans 47 years.
Instrument offsets are unresolved calibration differences, much of which are due to internal instrument scatter
(see Kopp & Lean, 2011).

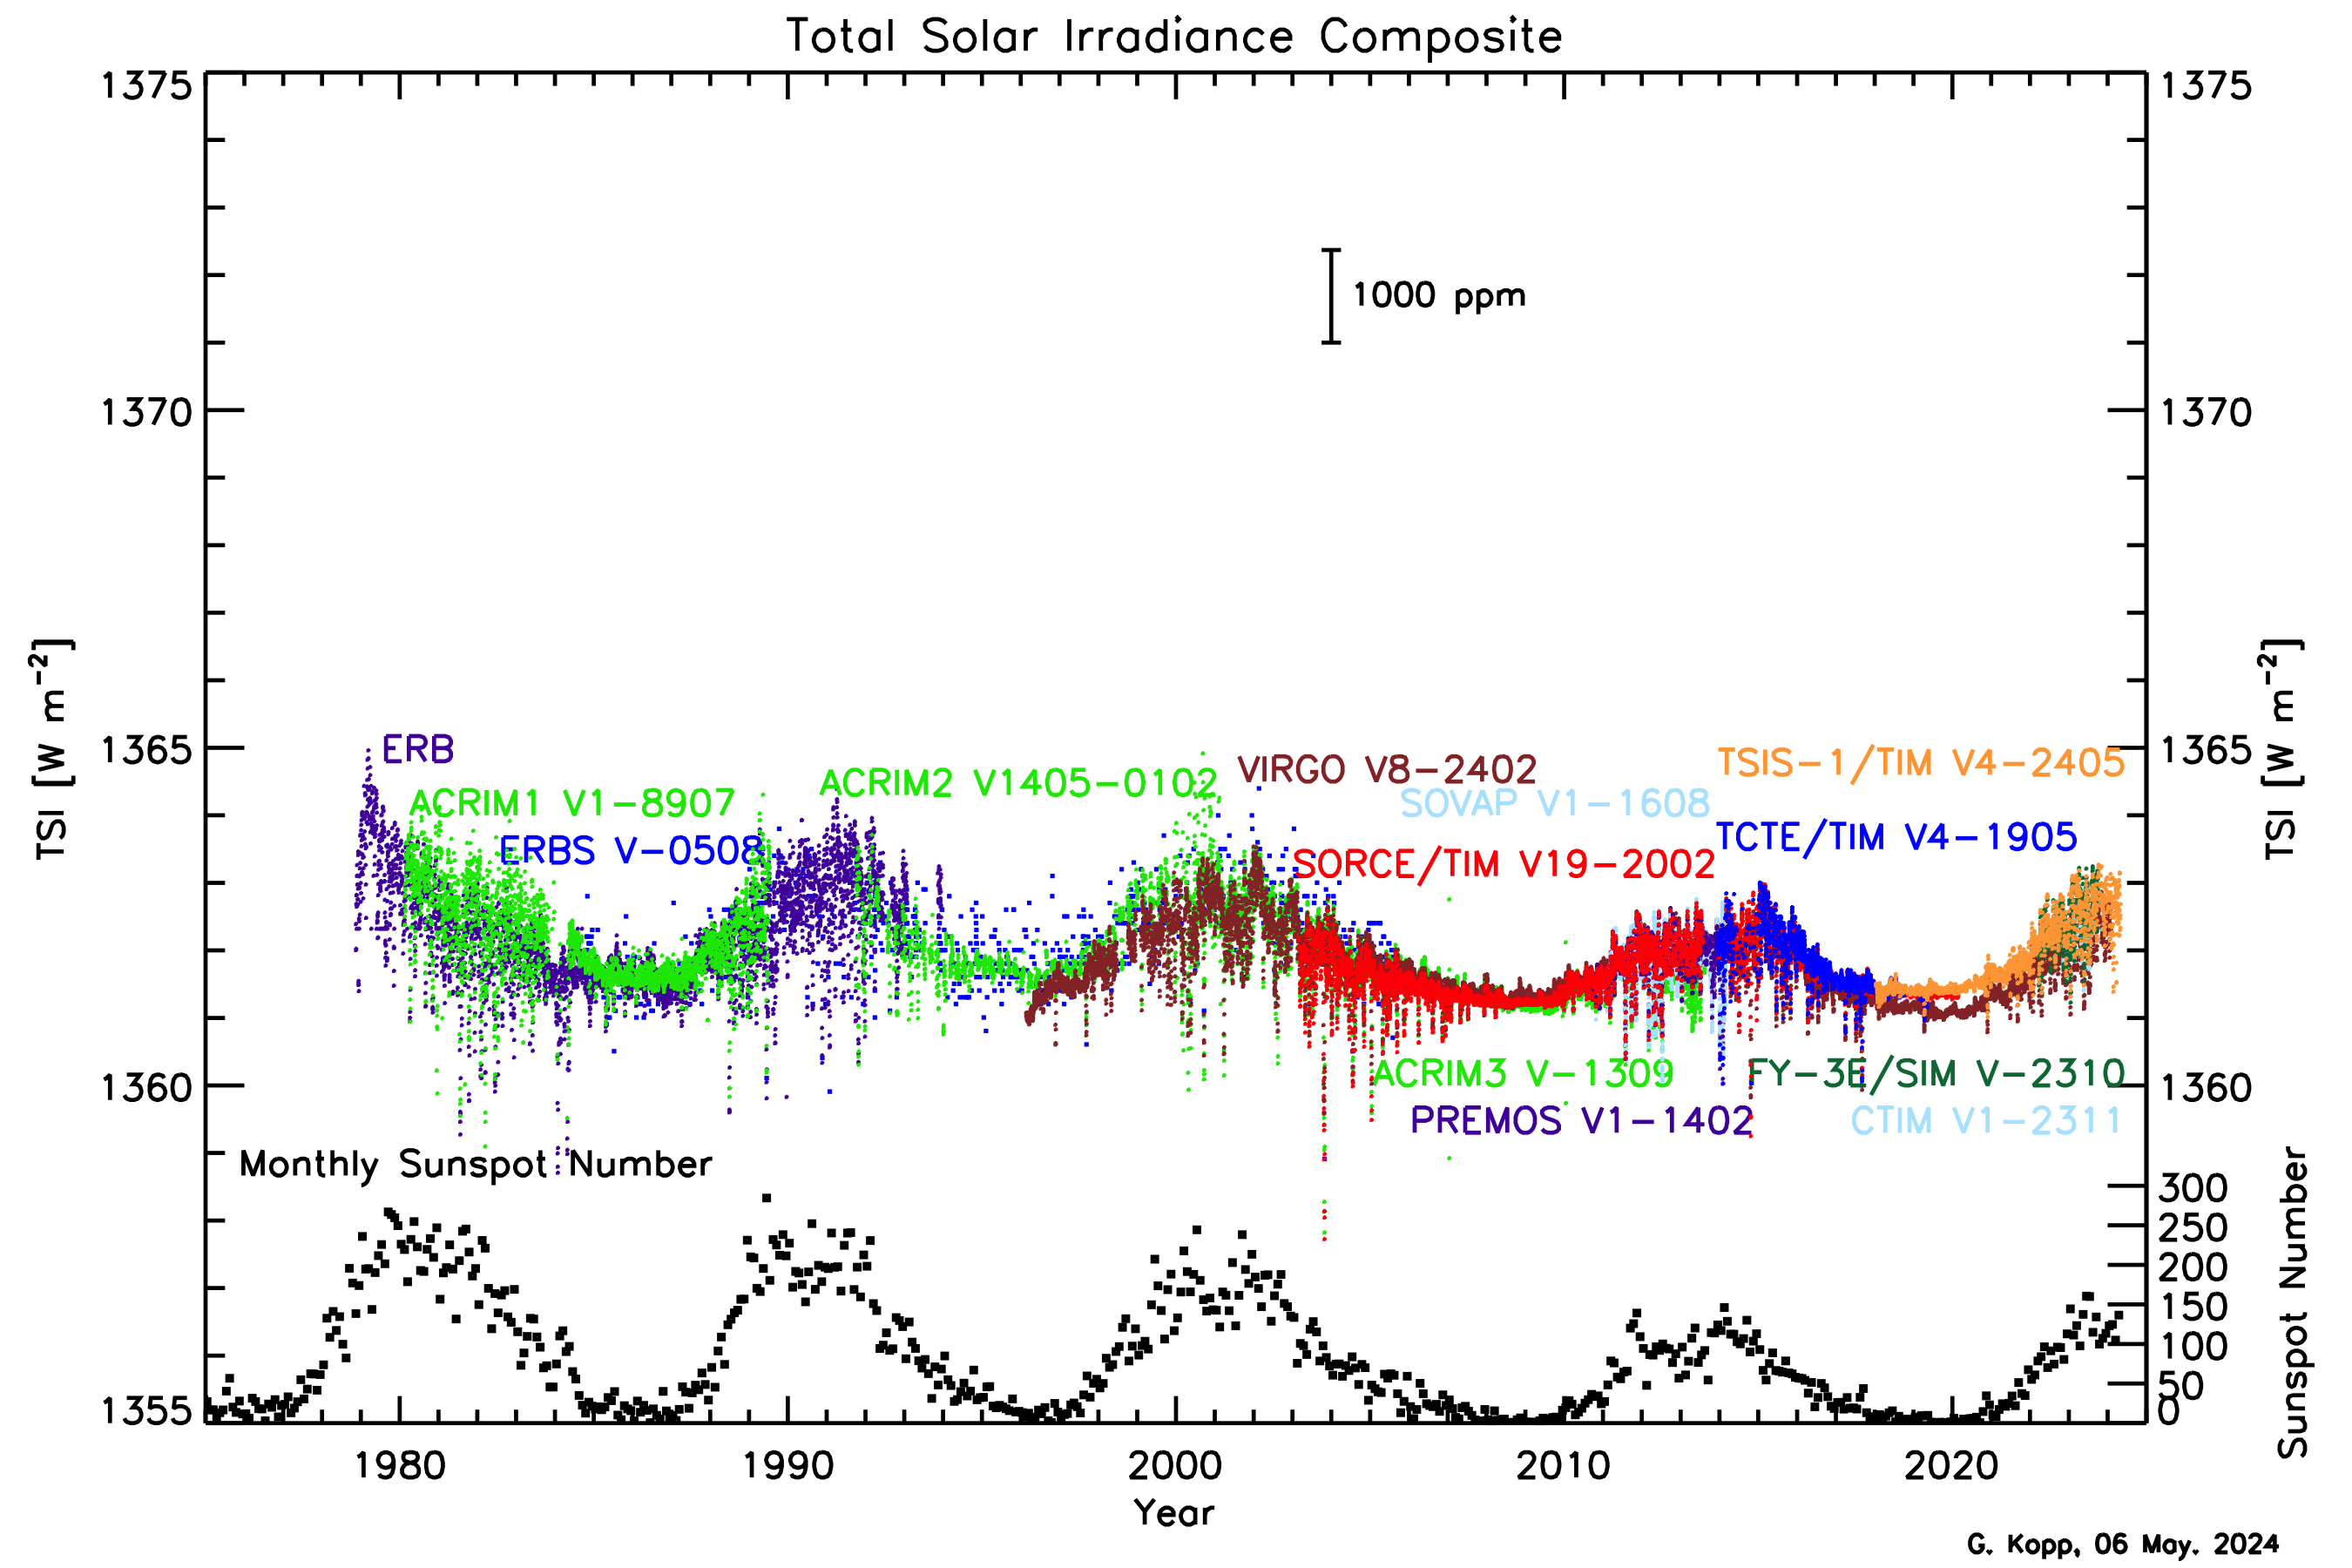
Data continuity via overlap from a series of instruments (below, left or top) allows adjustment to a common scale (below, right or bottom).
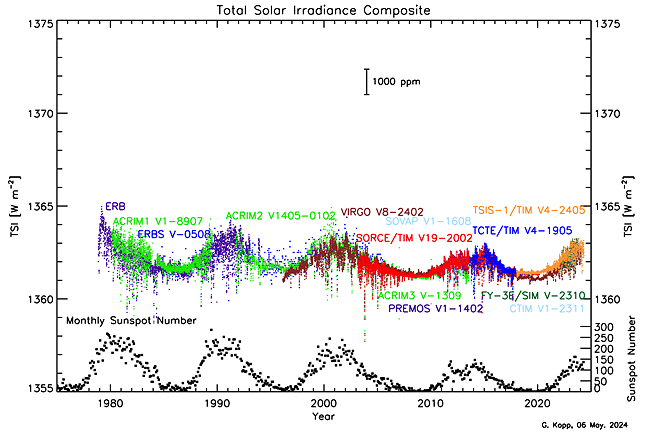
A new methodology to create a TSI composite has been defined by
Dudok de Wit et al.
Unlike previous composites, which have been created by individual-instrument principal investigators and thus reflect biases toward their instruments, this methodology:
- Uses time-varying weightings of all the available instrument data rather than binarily selecting only one instrument at any give time and relying on daisy-chaining, which propagates errors in time
- Uses a data-driven noise model whose uncertainties are estimated in a systematic way, providing a less-biased statistical approach for selecting instrument weightings
- Bridges data gaps smoothly via a multi-scale decomposition approach
- Provides time-dependent uncertainties
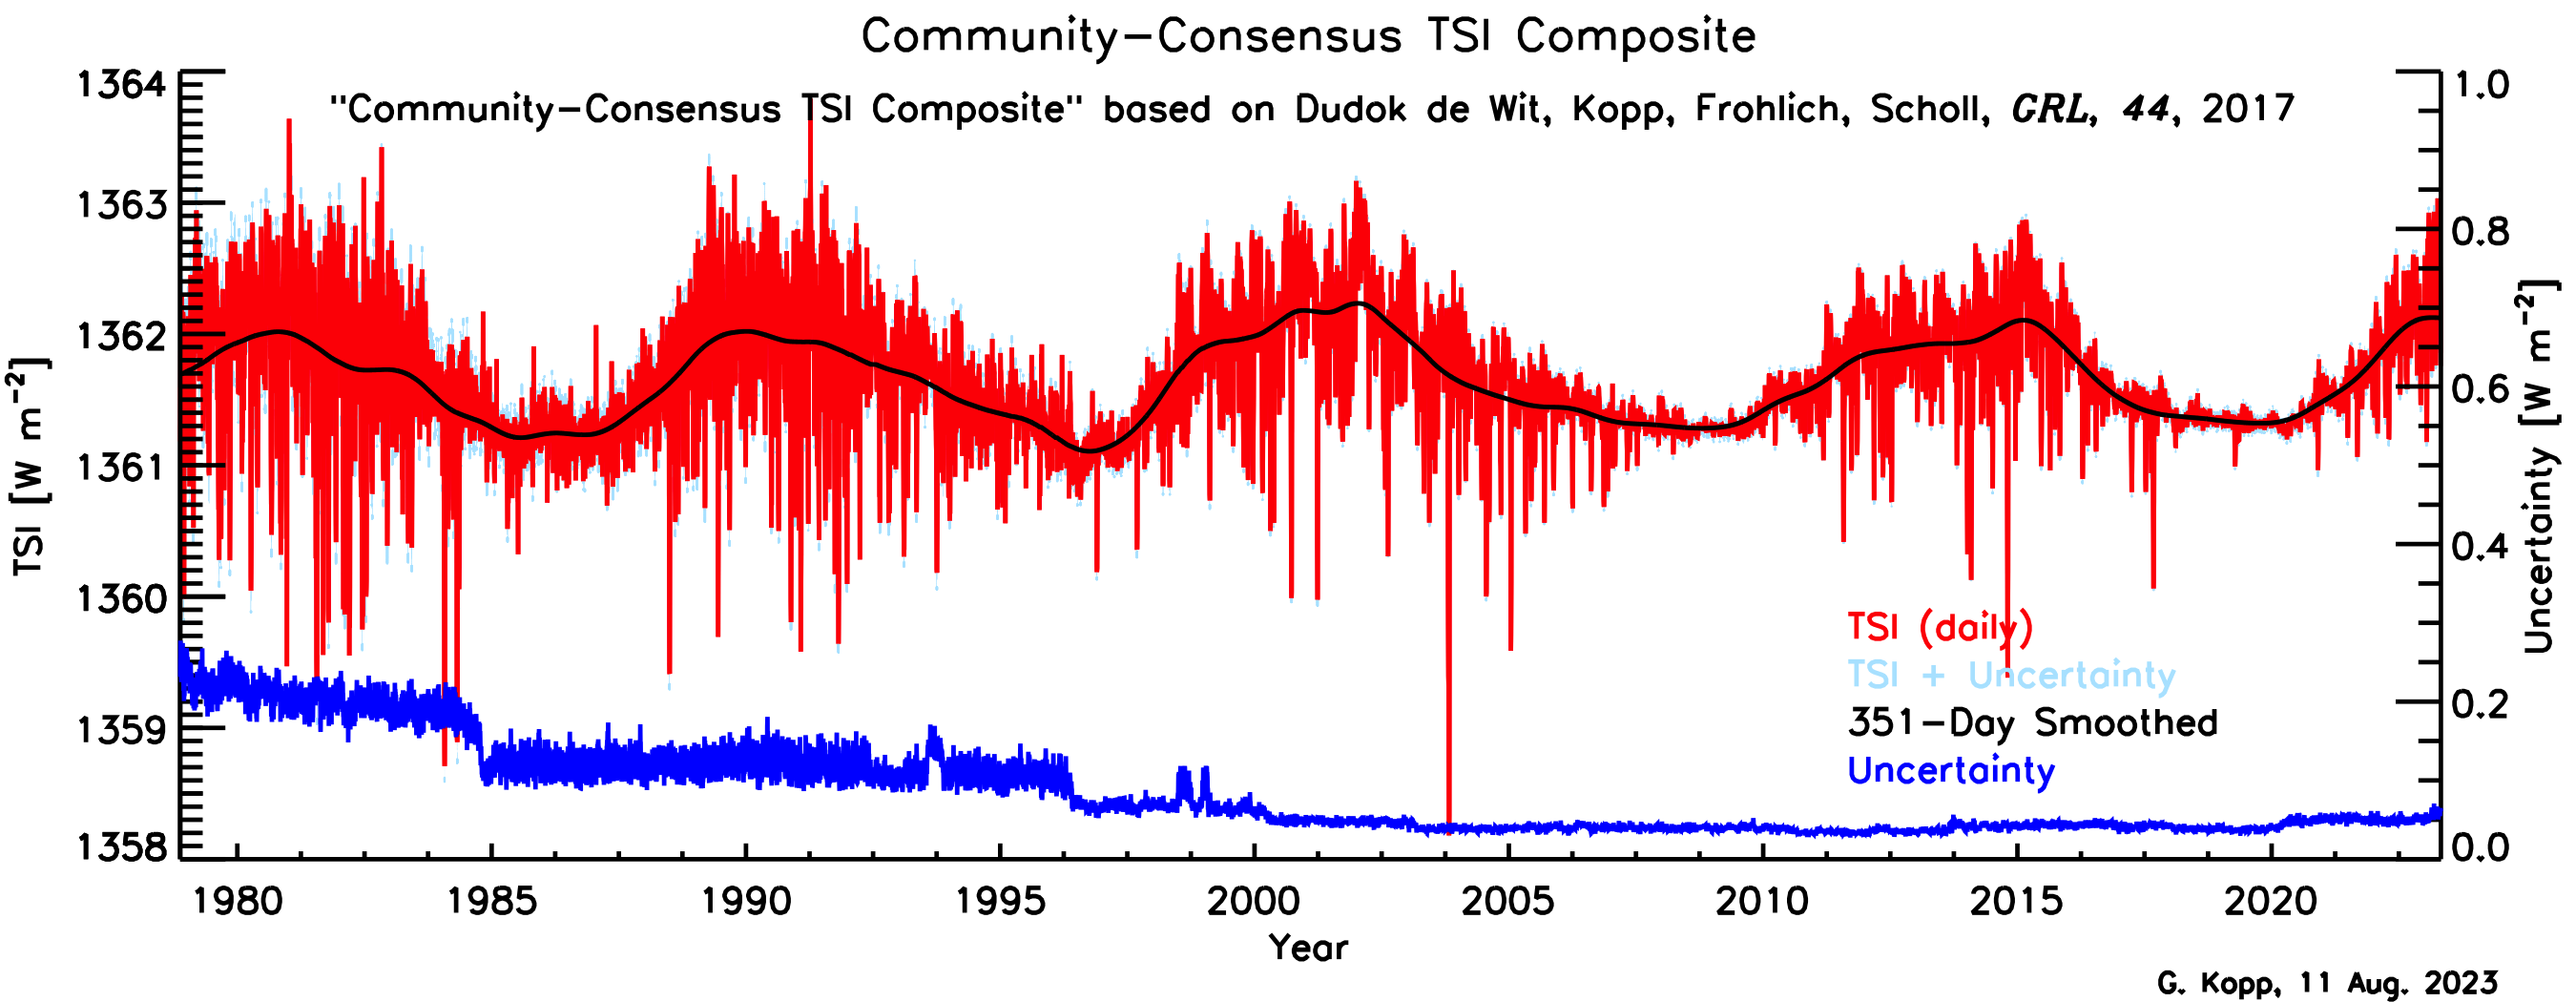
The composite below incorporates updates to the methodology applied to current TSI records. This "Community Consensus TSI Composite" is being refined by a former
ISSI
and an existing SIST team with representatives from most current and past TSI instruments. The composite is updated regularly.

Data are available
here.
TSI Movies
These movies show the solar surface and the corresponding TSI variability as measured by the SORCE/TIM
Three of these four movies, namely those in 2003, 2006, and 2014, are from active time-periods during the SORCE mission. They show correlations between sunspots on the solar disk and the resulting TSI. The 2003 movie shows the largest short-term decrease in TSI that has ever been measured during the "Halloween Storms" of that year. The 2007 movie shows a relatively low-sunspot period that nevertheless has TSI variability due to evolving and passing facular regions. (Note the vertical-axis scales differ.)
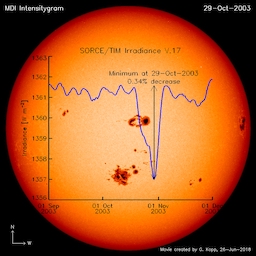
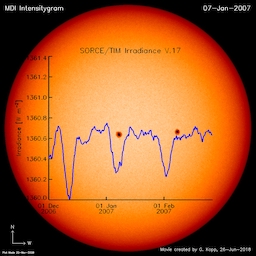
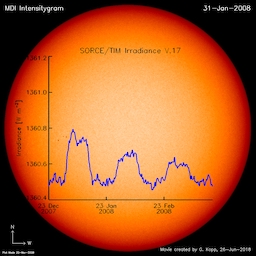
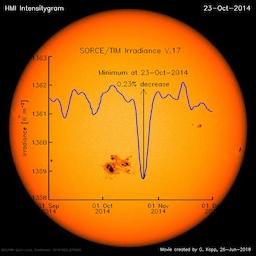
Each movie is accessible in OneDrive by clicking on the corresponding image above.
SORCE/TIM Mission Highlights
Key SORCE Discovery: The SORCE/TIM Determines a New, Lower Value of TSI Than Previous Measurements
Prior to the SORCE launch in 2003, on-orbit TSI instruments agreed with each other in measured TSI values near 1365 W/m^2 near solar minima. The new SORCE/TIM, including many optical, electrical, and calibration improvements over these prior instruments, measured values 0.35% lower than the other on-orbit instruments (see left-hand figure below). Initially disregarded by the community as an error in the TIM instrument, this difference has since been shown to be due to uncorrected scatter causing erroneously high measurements by other instruments, all of which have an optical design that differs from the TIM by allowing two to three times the amount of light intended for measurement into the instrument. The TIM, placing the instrument's small precision aperture at the entrance, only allows the light intended for measurement into the instrument interior, and hence is much less susceptible to scattered light.
Diagnostics with the TSI Radiometer Facility
(Kopp et al., SPIE, 2007)
of ground-based instruments representative of those on orbit have demonstrated that the scatter in non-TIM instrument designs is the primary cause of the higher readings by the other instruments. Applying scatter corrections to these instruments' data brings their values down to those measured by the TIM, which reports a value of 1360.8 W/m^2 representative of the 2008 solar minimum
(Kopp & Lean, 2011)
(see right-hand figure below).
This new lower TSI value reported initially by the SORCE/TIM has also been validated with the more-recently launched PICARD/PREMOS (brown data in right-hand plot below), the TCTE/TIM (blue data), and the TSIS-1/TIM (orange), all of which were calibrated (PREMOS) or validated (TCTE/TIM and TSIS-1/TIM) on the TSI Radiometer Facility prior to launch.
TSI Record Prior to 2011 Corrections Being Applied to Non-TIM Instruments
|
Contemporary TSI Record Including TRF Corrections to Select Non-TIM Instruments
|
Planetary Transit Observations
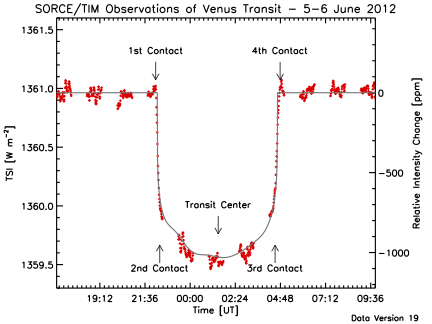
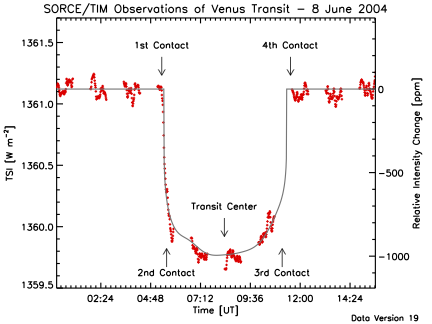
The TIM measured a decrease in the TSI (red dots) as Venus transited the Sun on both 5-6 June 2012 and 8 June 2004. In agreement with predictions (grey curve) accounting for solar limb-darkening and the SORCE position, the incident sunlight dropped approximately 0.1% during the transits, which is comparable to the effect of a medium-sized sunspot. The gaps in the plotted data are from times when the SORCE spacecraft was in the Earth's shadow and could not view the Sun. Both 1st and 2nd Contacts, as Venus began its transit across the solar disk, were observed directly for both Venus transits. During the 2012 transit, egress (3rd and 4th Contacts) was also observed, although this occurred when the spacecraft was occulted by the Earth in 2004. The increases in brightness near ingress and egress during the transit are due to solar limb-darkening, which makes the center of the solar disk brighter than the edges and hence the transit-depth greater when Venus is nearer to disk-center. The small fluctuations in brightness on short timescales are from normal solar convection and oscillations, and can be seen in the un-occulted times both before and after the transits.
Exo-solar planets are being discovered via transits in front of their stars using similar photometric techniques.
(Published in Kopp, G.,
Science Highlights and Final Updates from 17 Years of Total Solar Irradiance from the SOlar Radiation and Climate Experiment/Total Irradiance Monitor (SORCE/TIM),
Solar Physics, Topical Collection, 2021, doi: 10.1007/s11207-021-01853-x )
TIM Observations of 2012 Venus Transit
|
TIM Observations of 2004 Venus Transit
|
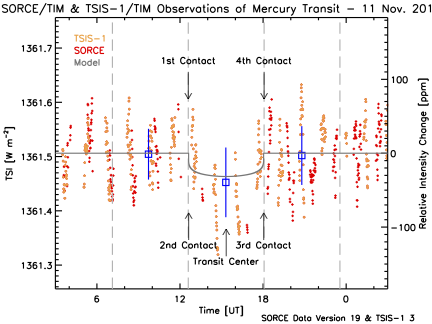
TIM Observations of 2019 Mercury Transit
Both the SORCE/TIM and the TSIS-1/TIM observed the 11 Nov. 2019 Mercury transit.
The high-cadence TSIS-1/TIM TSI values are plotted in orange and SORCE (scaled to the TSIS-1 values) in red. [SORCE unfortunately didn't get many observations during the actual transit due to its ongoing battery issues (since mid 2013).] The scatter in these high-cadence TSI values is almost all due to actual solar variability. The blue boxes and whiskers are, respectively, the averages and standard deviations of equal-length time regions before, during, and after the transit from both instruments. The grey curve is the predicted signal for a limb-darkened solar disk viewed from the TSIS-1.
As with the three prior Mercury transits, the transit signal is likely there, but is not something that would be readily apparent without knowing where to look, since the ~100-ppm background solar variations mask the 37-ppm expected transit-depth signal. Further supporting that this should not be considered a true detection is that the two TSIS-1 orbits just inside the transit still show high TSI values, when they should be lower if truly due to the transit.
|
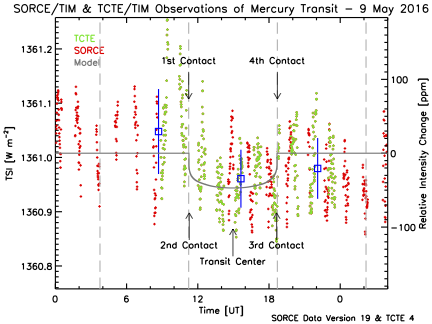
TIM Observations of 2016 Mercury Transit
Both the SORCE/TIM and the TCTE/TIM observed the 9 May 2016 Mercury transit. The high-cadence data from both instruments are combined and plotted in red below. During this transit, a modeled light-curve (grey) accounting for solar limb-darkening and the two spacecrafts' positions indicates that Mercury should decrease the sunlight at the Earth by up to 47 ppm (0.005%). This is a larger decrease than during either of the prior two Mercury transits, which were observed by the SORCE/TIM only. This decrease is suggestively discernible in the red TSI data despite the underlying continual solar variations, benefitting from the transit's larger net decrease, the TIM's precision, and the combination of both datasets. Averages of the TSI values from equal-duration times before, during, and after the transit (blue squares) indicate a measured decrease of 38 ppm (0.004%); although the uncertainties on this decrease are comparable to the value itself, so this really should not be considered a true planetary-transit "detection."
|
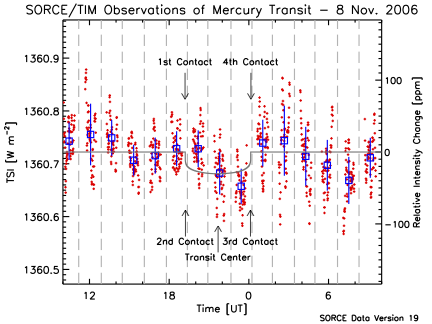
TIM Observations of 2006 Mercury Transit
The TIM viewed the Sun for the three SORCE orbits during which the 8 Nov. 2006 Mercury transit occurred. During this transit, Mercury decreased the sunlight at the Earth by up to 30 ppm (0.003%), indicated by the modeled light-curve (grey) that accounts for solar limb-darkening and the SORCE position. Even with the TIM's precision, this transit is not independently detectable in TSI because of the underlying continual solar variations, which have much greater amplitude. High cadence TIM measurements are shown in red with orbital averages and their standard deviations in blue. The spacecraft was in the Earth's shadow for both ingress and egress.
|
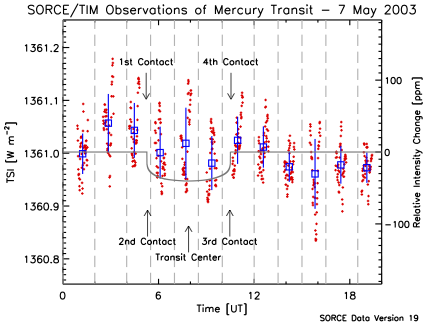
TIM Observations of 2003 Mercury Transit
The TIM also measured during the 7 May 2003 Mercury transit, which had a slightly larger effect than the 2006 transit. As the modeled light-curve (grey) indicates, Mercury decreased the sunlight at the Earth by 40 ppm (0.004%) at the peak of this transit. As with the 2006 observations, this transit is not readily apparent in TSI measurements alone because of the underlying solar variations. Again during this transit, the SORCE spacecraft was in the Earth's shadow for both ingress and egress. High cadence TIM measurements are shown in red with orbital averages and their standard deviations in blue.
(Published in Kopp, G., Lawrence, G., and Rottman, G.,
"The Total Irradiance Monitor (TIM): Science Results,"
Solar Physics, 230, 1, Aug. 2005, pp. 129-140.)
|
Total Flare Energy Measured in TSI
The TIM is the first TSI instrument with the sensitivity and low noise to report a solar flare detection in TSI (Kopp et al., AAS 2004; Woods et al., 2005). While flares are readily detectable at short wavelengths, where the Sun generally has relatively low signal, their contribution to the entire energy output from the Sun is almost negligibly small, making them extremely difficult to detect in TSI. Nevertheless, TSI observations provide a direct means of measuring the total radiant energy output from a flare, as these measurements integrate solar energy over all wavelengths.
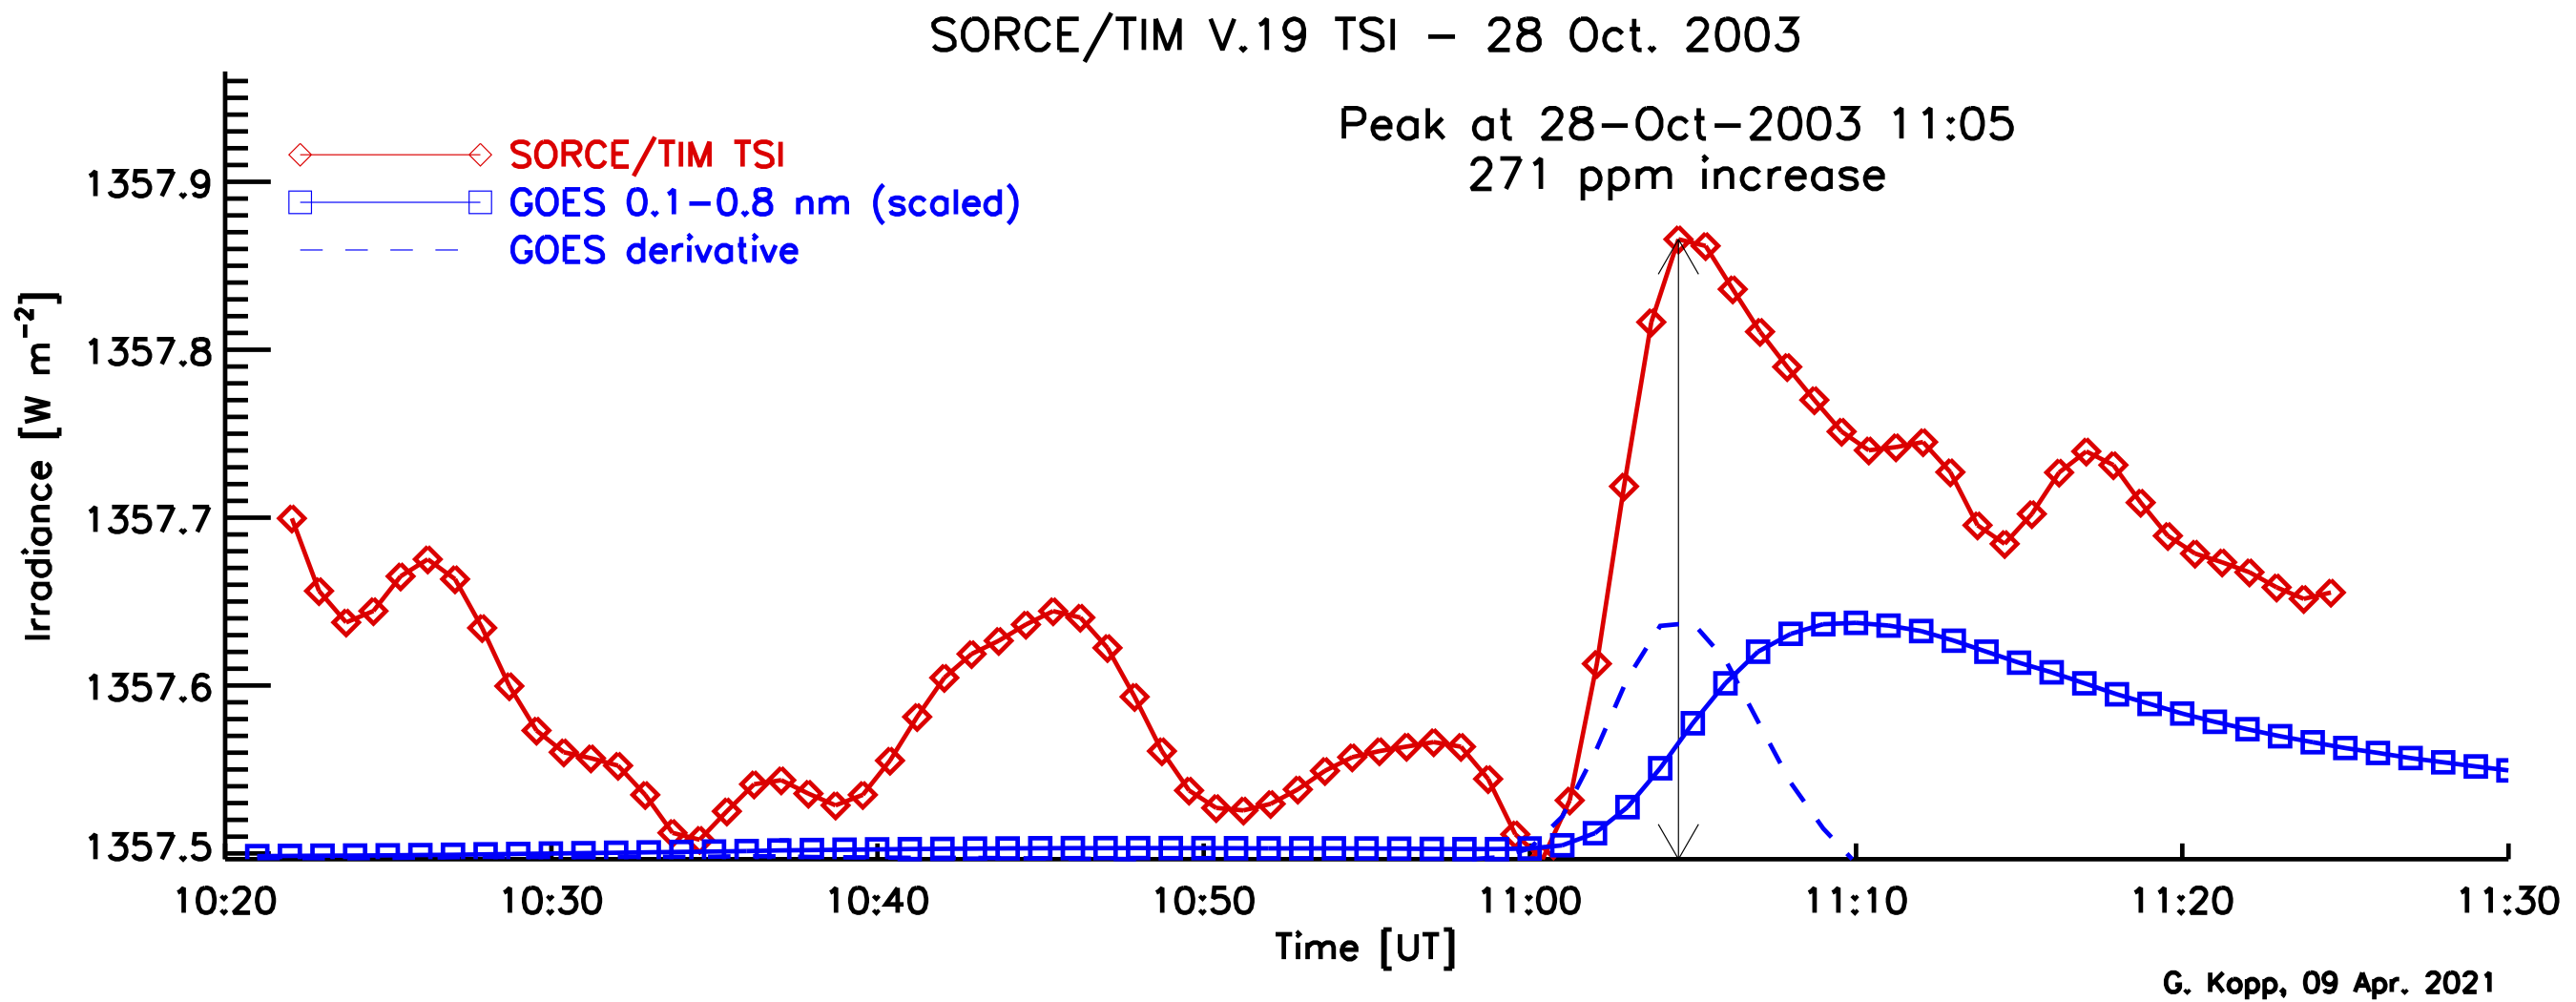
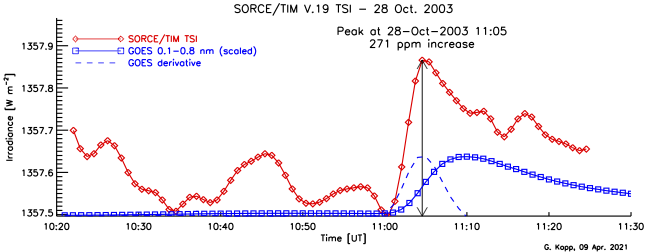
The First Solar Flare Observed in TSI
NOAA/GOES reported peak X-ray (0.1-0.8 nm) values from the X17 flare at 11:10 UT on 28 Oct. 2003. The TIM measured a significant and sudden increase in TSI slightly prior to this, putting the TSI peak nearly in phase with the hard X-rays (as indicated by the derivative of the softer GOES X-rays). The abruptness of this increase and the following gradual decrease are typical of flares observed at EUV and X-ray wavelengths.
(Kopp et al., AAS 2004; Woods et al., GRL, 2004)
|
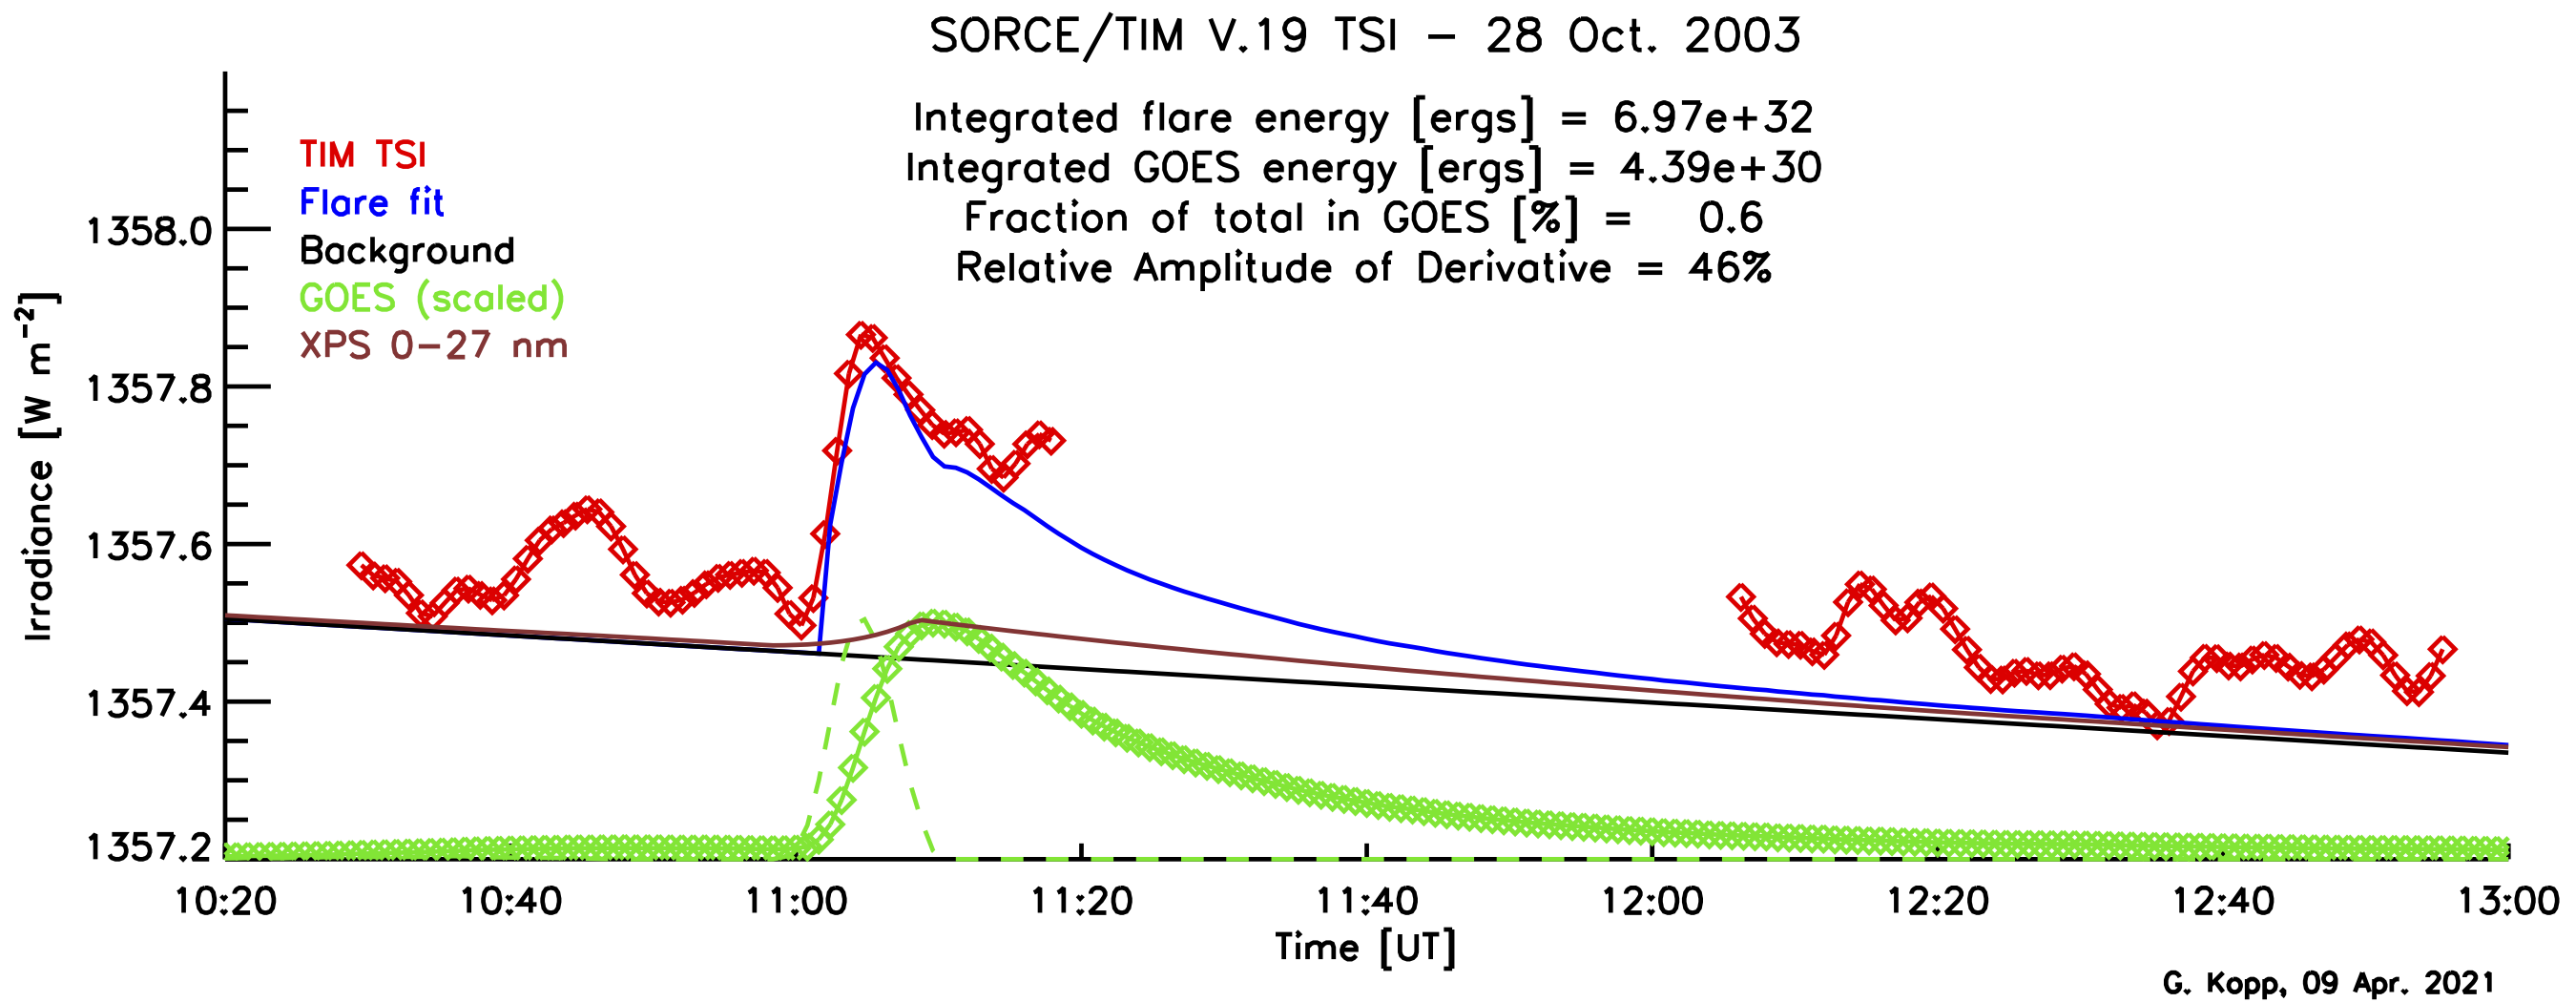
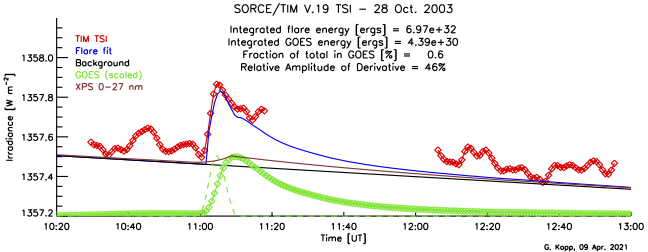
TIM Flare Measurements Provide Total Flare Energy
The TSI measurements of a flare provide the total, spectrally-integrated flare energy, which we estimate at 5e32 ergs for the 28 Oct. 2003 X17 flare.
(Kopp et al., AAS 2004; Woods et al., GRL, 2004)
|
What is the Solar Flux as a Function of Latitude & Longitude on the Earth?
While the TSI gives the top-of-atmosphere net radiant energy from the Sun reported at a distance of 1 AU, different positions on the Earth receive less flux due to inclination relative to the incoming sunlight. These vary throughout the year due to orbital effects in the Earth-axis tilt and Sun-Earth distance. These values are computed and tabulated in
this Solar Energy article.
TIM References
Kopp, G., Némec, N., and Shapiro, A., Correlations Between Total and Spectral Solar Irradiance Variations, Astrophysical Journal, 964, 1, 60, 2024, https://doi.org/10.3847/1538-4357/ad24e5
Kopp, G., Daily solar flux as a function of latitude and time, Solar Energy, 249, 250-254, Jan. 2023, doi: https://doi.org/10.1016/j.solener.2022.11.022
Kopp, G., Science Highlights and Final Updates from 17 Years of Total Solar Irradiance from the SOlar Radiation and Climate Experiment/Total Irradiance Monitor (SORCE/TIM), Solar Physics, Topical Collection, 2021, doi: 10.1007/s11207-021-01853-x
Woods, T.N., Harder, J.W., Kopp, G., McCabe, D., Rottman, G., Ryan, S., and Snow, M., Overview of the Solar Radiation and Climate Experiment (SORCE) Seventeen Year Mission, Solar Physics, Topical Collection, 2021, doi: https://doi.org/10.1007/s11207-021-01869-3
Kopp, G. and Shapiro, A., Irradiance Variations of the Sun and Sun-like Stars - Overview of Topical Collection, Solar Physics, ISSN 0038-0938 Topical Collection, 2021, doi: 10.1007/s11207-021-01802-8
Kopp, G., Solar Irradiance: Instrument-Based Advances, Proceedings of the International Astronomical Union, Volume 14, Symposium A30: Astronomy in Focus XXX, August 2018, pp. 354 - 357, doi: https://doi.org/10.1017/S1743921319004605
T. Dudok de Wit and G. Kopp, Solar irradiance: from multiple observations to a single composite, Proceedings of the International Astronomical Union, Volume 14, Symposium A30: Astronomy in Focus XXX, August 2018, pp. 336 - 338, doi: https://doi.org/10.1017/S174392131900454X
Kopp, G.,
Earth's Incoming Energy: The Total Solar Irradiance, in
Reference Module in Earth Systems and Environmental Sciences, Elsevier, 2016, ISBN 9780124095489.
T. Dudok de Wit, G. Kopp, C. Fröhlich, and M. Schöll,
Methodology to create a new Total Solar Irradiance record: Making a composite out of multiple data records,
Geophys. Res. Letters, doi:10.1002/2016GL071866, 2017.
Kopp, G.,
Magnitudes and Timescales of Total Solar Irradiance Variability,
Journal of Space Weather and Space Climate, 6, A30, 11 pp., 2016, doi: 10.1051/swsc/2016025.
Kopp, G., Krivova, N., Lean, J., and Wu, C.J.,
The Impact of the Revised Sunspot Record on Solar Irradiance Reconstructions,
Solar Physics, 15 pp., 2016, doi: 10.1007/s11207-016-0853-x.
Kopp, G.,
An Assessment of the Solar Irradiance Record for Climate Studies,
Journal of Space Weather and Space Climate, 4, A14,
DOI:10.1051/swsc/2014012, 2014.
Kopp, G., Fehlmann, A., Finsterle, W., Harber, D., and Heuerman, K.,
Total Solar Irradiance Data Record Accuracy and Consistency Improvements,
Metrologia, 49, S29-S33, 2012.
Kopp, G. and Lean, J.L.,
A New, Lower Value of Total Solar Irradiance: Evidence and Climate Significance,
Geophys. Res. Letters Frontier article, 38, L01706, doi:10.1029/2010GL045777, 2011.
Kopp, G., Heuerman, K., Harber, D., and Drake, V.,
The TSI Radiometer Facility - Absolute Calibrations for Total Solar Irradiance Instruments,
SPIE Proc. 6677-09, 2007; doi:10.1117/12.734553.
Kopp, G. and Lawrence, G.,
The Total Irradiance Monitor (TIM): Instrument Design,
Solar Physics, 230, 1, Aug. 2005, pp. 91-109.
Kopp, G., Heuerman, K., and Lawrence, G.,
The Total Irradiance Monitor (TIM): Instrument Calibration,
Solar Physics, 230, 1, Aug. 2005, pp. 111-127.
Kopp, G., Lawrence, G., and Rottman, G.,
The Total Irradiance Monitor (TIM): Science Results,
Solar Physics, 230, 1, Aug. 2005, pp. 129-140.
Kopp, G., Lawrence, G., and Rottman, G.,
Total Irradiance Monitor Design and On-Orbit Functionality,
SPIE Proc. 5171-4, 2003, pp. 14-25.
Lawrence, G.M., Kopp, G., Rottman, G., Harder, J., Woods, T., and Loui, H.,
Calibration of the Total Irradiance Monitor,
Metrologia 40, 2003, S78-S80.
Lawrence, G.M., Rottman, G., Kopp, G., Harder, J., McClintock, W., and Woods, T., "The Total Irradiance Monitor (TIM) for the EOS SORCE Mission," Earth Observing Systems V Proc. SPIE 4135-21, 2000, pp. 215-224.
Woods, T., Rottman, G., Harder, G., Lawrence, G., McClintock, B., Kopp, G., and Pankratz, C., "Overview of the EOS SORCE Mission," SPIE 4135, 2000, pp. 192-203.
Lawrence, G.M., Rottman, G., Harder, J., and Woods, T.,
The Solar Total Irradiance Monitor:TIM,
Metrologia 37, 2000, pp. 407-410.