by Kenneth A. Kozar
Spring 1997
Data flow diagrams do not show decisions or timing of events. Their function is to illustrate data sources, destinations, flows, stores, and transformations. The capabilities of data flow diagramming align directly with general definitions of systems. Data flow diagrams are an implementation of a method for representing systems concepts including boundaries, input/outputs, processes/subprocesses, etc.
The data flow diagram is analogous to a road map. It is a network model of all possibilities with different detail shown on different hierarchical levels. The process of representing different detail levels is called "leveling" or "partitioning" by some data flow diagram advocates.
Like a road map, there is no start or stop point, no time or timing, or steps to get somewhere. We just know that the data path must exist because at some point it will be needed. A road map shows all existing or planned roads because the roads are needed. If we were to add usage patterns or great detail to the road network on a state road map, it would become unusable to plan routes. When we look at the road map of Illinois, we know we could find more detail of the Chicago vicinity, and then even find more detail of the street network within the Chicago vicinity.
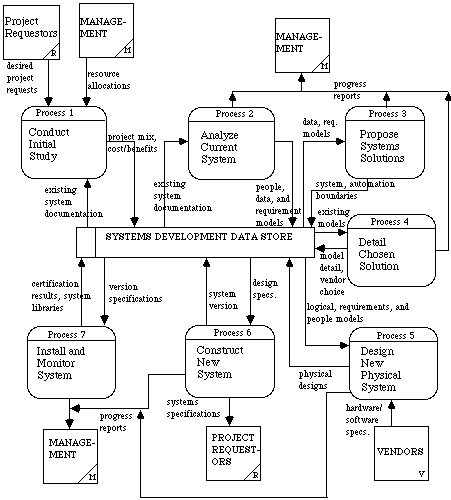
See the data flow diagram of the systems development process. Note that the diagram is a detailing of the context diagram shown earlier. The data flows to and from the external entities shown on the context diagram all appear on the data flow diagram. Note that only four symbols are used.

Actual procedures, such as those to accomplish a specific task, would be detailed in a procedure specification. Procedures will present not only data manipulation, but control, such as deciding which path to take in performing a procedure. Data flow diagrams present all possible paths. Control, or how to select a specific path, is not shown on the data flow diagram. Procedures would be analogous to a "Trip-Tik" that the American Automobile Association uses for getting from a specific location to a specific destination. The "Trip-Tik" would have detailed maps if detail was needed to avoid getting lost.
Repetition, how many times a procedure is performed or when it is performed, is not included on the data flow diagram. Remember that the data flow diagram only presents a network of paths. It presents the network at a degree of detail that is understandable and usable for a select set of users. Different views at different levels of the same system are needed for users at different levels of authority and responsibility to understand and review their relevant system portion.
Detail that is not shown on the different levels of the data flow diagram such as volumes, timing, frequency, etc. is shown on supplementary diagrams or in the data dictionary. For example, data store contents may be shown in the data dictionary.