The Technique of Data Flow Diagramming
by Kenneth A. Kozar
Spring 1997
THE TECHNIQUE OF DATA FLOW DIAGRAMMING
This section describes in detail the data flow diagramming technique. It is intended to serve as a handbook to guide the reader in developing data flow diagramming skills.
Definition:
Data Flow Diagramming is a means of representing a system at any level of detail with a graphic network of symbols showing data flows, data stores, data processes, and data sources/destinations.
Purpose/Objective:
The purpose of data flow diagrams is to provide a semantic bridge between users and systems developers. The diagrams are:
- graphical, eliminating thousands of words;
- logical representations, modeling WHAT a system does, rather than physical models showing HOW it does it;
- hierarchical, showing systems at any level of detail; and
- jargonless, allowing user understanding and reviewing.
The goal of data flow diagramming is to have a commonly understood model of a system. The diagrams are the basis of structured systems analysis. Data flow diagrams are supported by other techniques of structured systems analysis such as data structure d
iagrams, data dictionaries, and procedure-representing techniques such as decision tables, decision trees, and structured English.
Data flow diagrams have the objective of avoiding the cost of:
- user/developer misunderstanding of a system, resulting in a need to redo systems or in not using the system.
- having to start documentation from scratch when the physical system changes since the logical system, WHAT gets done, often remains the same when technology changes.
- systems inefficiencies because a system gets "computerized" before it gets "systematized".
- being unable to evaluate system project boundaries or degree of automation, resulting in a project of inappropriate scope.
Description:
Data Flow Diagrams are composed of the four basic symbols shown below.
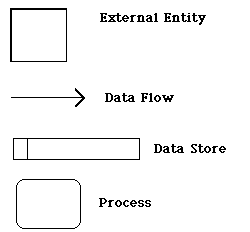
The External Entity symbol represents sources of data to the system or destinations of data from the system.
The Data Flow symbol represents movement of data.
The Data Store symbol represents data that is not moving (delayed data at rest).
The Process symbol represents an activity that transforms or manipulates the data (combines, reorders, converts, etc.).
Any system can be represented at any level of detail by these four symbols.
External Entities:
- are named with appropriate name.
- can be duplicated, one or more times, on the diagram to avoid line crossing.
- determine the system boundary. They are external to the system being studied. They are often beyond the area of influence of the developer.
- can represent another system or subsystem.
- go on margins/edges of data flow diagram.
Data Flows:
- are represented with a line with an arrowhead on one end. A fork in a data flow means that the same data goes to two separate destinations. The same data coming from several locations can also be joined.
- should only represent data, not control.
- are ALWAYS named. Name is not to include the word "data".
- are referenced by a combination of the identifiers of the constructs that the data flow connects. (14-A references a data flow from process 14 to external entity A)
Data Stores:
- are generic for physical files (index cards, desk drawers, magnetic disk, magnetic tape, shirt pocket, human memory, etc.)
- are named with an appropriate name, not to include the word "file", and numbered with a number preceded with a capital letter D
- can be duplicated, one or more times, to avoid line crossing.
- can show two or more systems that share a data store. This is done by adding a solid stripe on the left boundary. (Figure 5.34) This can occur in the case of one system updating the data store, while the other system only accesses the data. For ex
ample, the data store could be a freight rate book that one system builds and maintains, but is used by the represented system.
- are detailed in the data dictionary or with data description diagrams.
Processes:
- show data transformation or change. Data coming into a process must be "worked on" or transformed in some way. Thus, all processes must have inputs and outputs. In some (rare) cases, data inputs or outputs will only be shown at more detailed levels
of the diagrams. Each process in always "running" and ready to accept data.
- are represented by a rounded corner rectangle
- are named with one carefully chosen verb and an object of the verb. There is no subject. Name is not to include the word "process". Each process should represent one function or action. If there is an "and" in the name, you likely have more than o
ne function (and process).
- have physical location shown only for existing physical systems or a physical design is being represented.
- are numbered within the diagram as convenient. Levels of detail are shown by decimal notation. For example, top level process would be Process 14, next level of detail Processes 14.1-14.4, and next level with Processes 14.3.1-14.3.6.
- should generally move from top to bottom and left to right.
Procedure:
The procedure for producing a data flow diagram is to:
- identify and list external entities providing inputs/receiving outputs from system;
- identify and list inputs from/outputs to external entities;
- create a context diagram with system at center and external entities sending and receiving data flows;
- identify the business functions included within the system boundary;
- identify the data connections between business functions;
- confirm through personal contact sent data is received and vice-versa;
- trace and record what happens to each of the data flows entering the system (data movement, data storage, data transformation/processing)
- attempt to connect any diagram segments into a rough draft;
- verify all data flows have a source and destination;
- verify data coming out of a data store goes in;
- redraw to simplify--ponder and question result;
- review with "informed";
- explode and repeat above steps as needed.
Guidelines/Gumption Traps:
(Places where DFDing can go astray)
- System boundary establishment is an important judgment call. External entities aid in determining where the boundary is established. An interfacing system can be shown as an external entity. It may be necessary to dictate the input of the external
entity to assure system control. For example, customers may be required to submit orders or refund requests containing specific information which may require that the system aid in completion of a form. Use of output such as reports by management may re
quire some agreement on tactics to be performed which may mean the entity becomes part of the system, not external to it. When in doubt, include the external entity as processes within the system and then evaluate with those concerned.
- Label your processes carefully and vividly. A process that is labeled "Produce Report" and has the output of "Report" tells a reviewer very little. If you have trouble labeling anything on the diagram, it often is because you do not have adequate un
derstanding. Choose names carefully.
- Think logical, not physical. Ignore media, color, font, layout, packaging, time, sequencing, etc. Think "what", not "how". Something logical can be implemented physically in more than one way. Including "when" and "where" and "how" means you are g
etting physical.
- Think data, not control, flow. Data flows are pathways for data. Think about what data is needed to perform a process or update a data store. A data flow diagram is not a flowchart and should not have loops or transfer of control. Think about the
data flows, data processes, and data storage that are needed to move a data structure through a system.
- Concentrate first on what happens to a "good" transaction. Systems people have a tendency to lose sight of the forest because they are so busy concentrating on the branches of the trees.
- Reviewers will not be convinced by confusion. A quality data flow diagram will be so simple and straightforward that people will wonder what took you so long.
- Data store to data store, external entity to external entity, or external entity to data store connection usually do not make sense. Data flows with an arrowhead on each end cause confusion in labeling. Do not use them.
- Do not try to put everything you know on the data flow diagram. The diagram should serve as index and outline. The index/outline will be "fleshed out" in the data dictionary, data structure diagrams, and procedure specification techniques.
Good Luck, Have Fun, and Stay on those Happy Trails......